Free Access
Fig. 7.
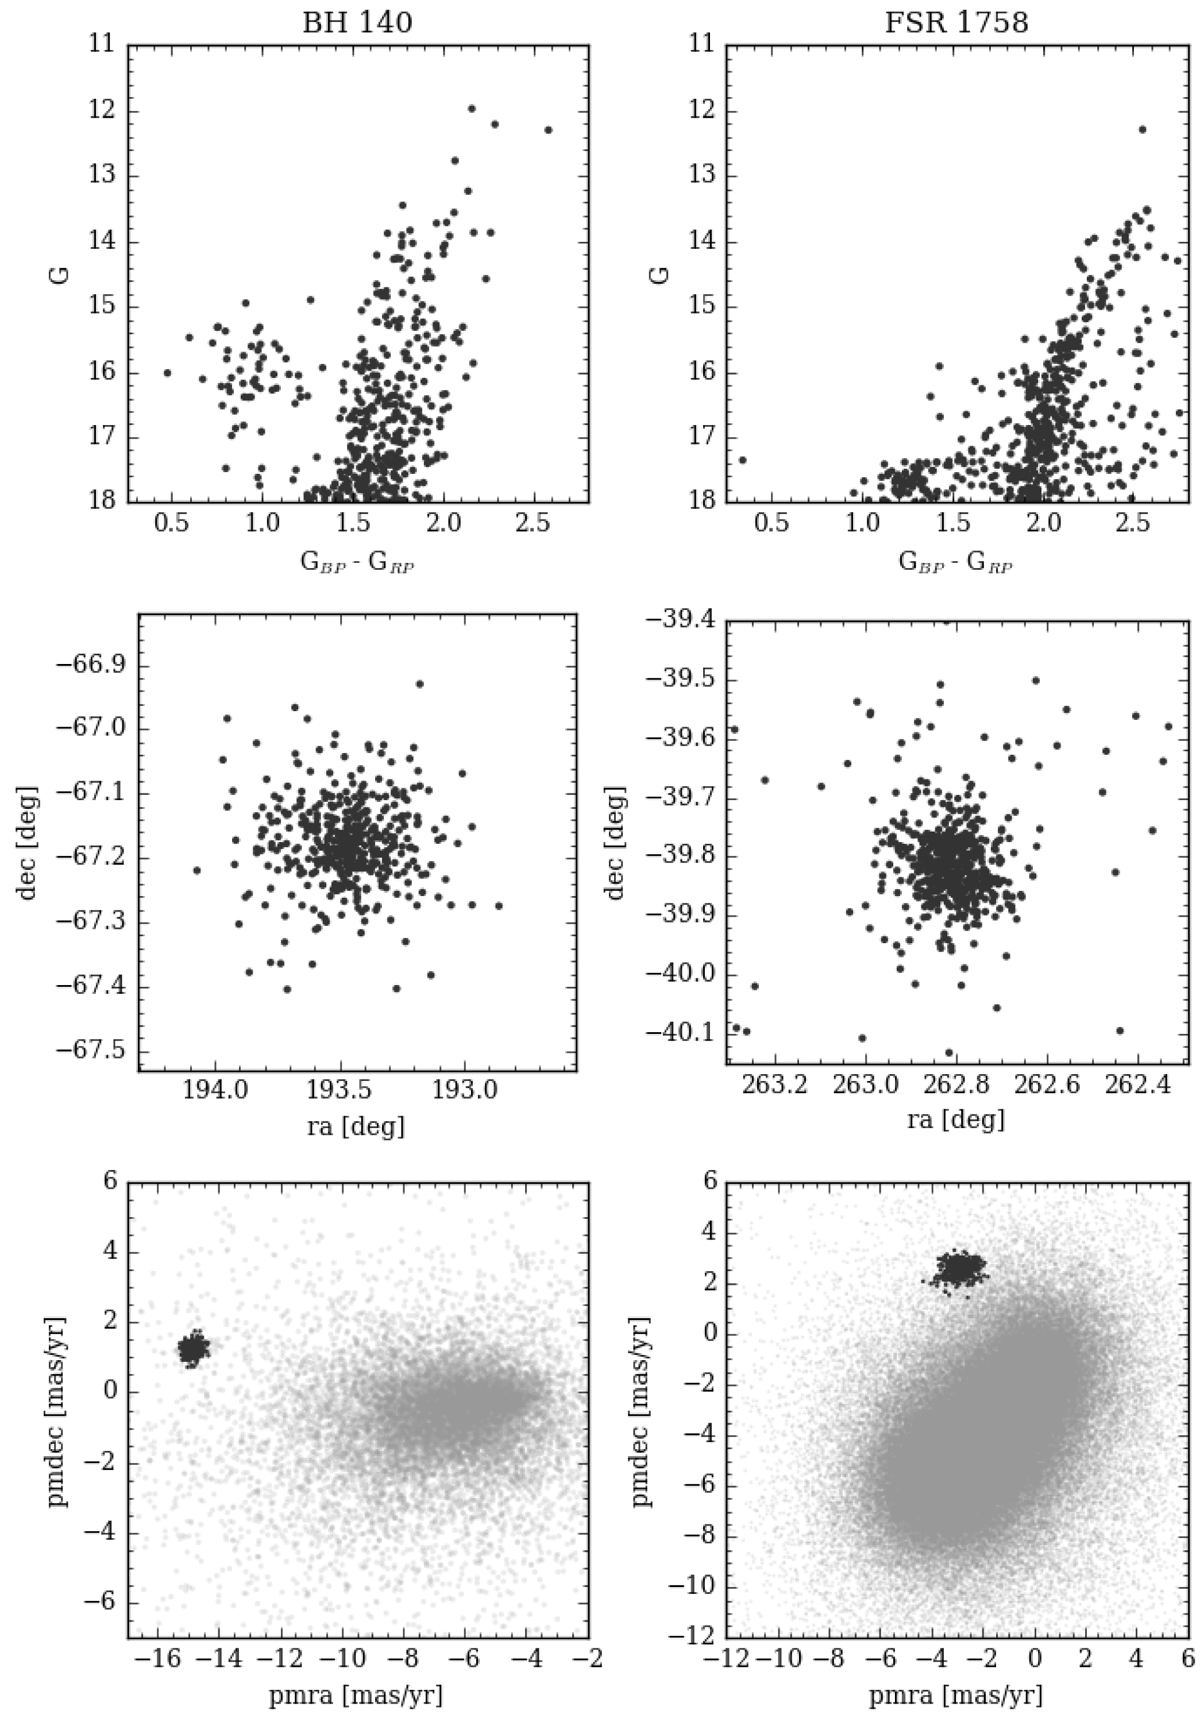
Top left panel: colour-magnitude diagram for BH 140. Middle left panel: distribution on the sky for the same stars. Bottom left panel: proper motion diagram showing the field in light grey, and the cluster stars as black dots. Right column panel: same for FSR 1758.
Current usage metrics show cumulative count of Article Views (full-text article views including HTML views, PDF and ePub downloads, according to the available data) and Abstracts Views on Vision4Press platform.
Data correspond to usage on the plateform after 2015. The current usage metrics is available 48-96 hours after online publication and is updated daily on week days.
Initial download of the metrics may take a while.