Fig. 9.
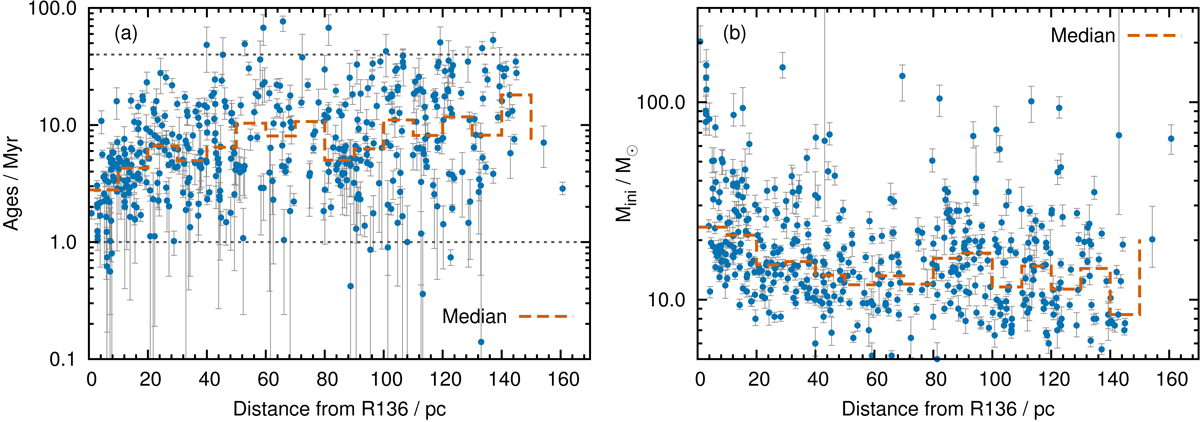
Distribution of ages (panel a) and initial masses (panel b) of our sample stars as a function of distance from the central R136 star cluster. The dashed lines show the median age and mass in 10 pc distance intervals and the grey dotted lines highlight ages of 1 and 40 Myr. The median ages and masses have not been corrected for sample completeness (cf. Sect 2.3).
Current usage metrics show cumulative count of Article Views (full-text article views including HTML views, PDF and ePub downloads, according to the available data) and Abstracts Views on Vision4Press platform.
Data correspond to usage on the plateform after 2015. The current usage metrics is available 48-96 hours after online publication and is updated daily on week days.
Initial download of the metrics may take a while.