Fig. 3.
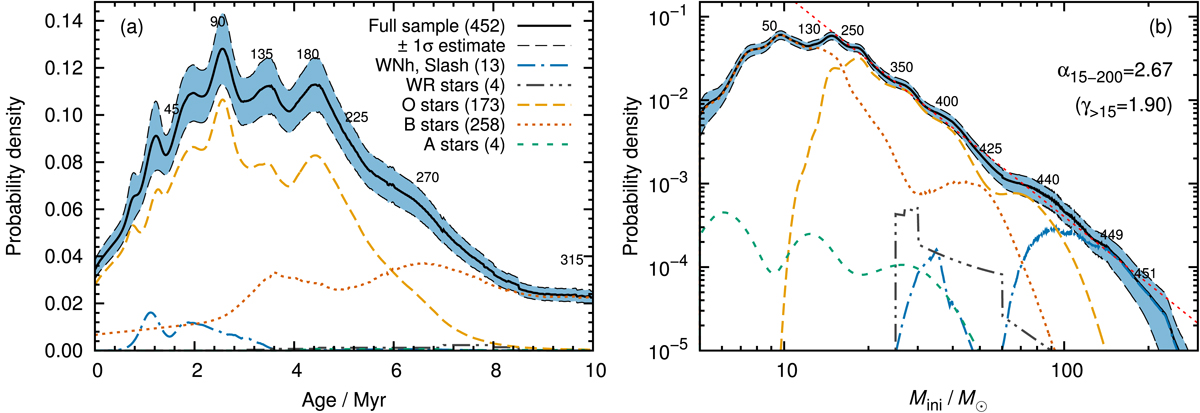
Probability density functions of ages (panel a) and initial masses (panel b) of all stars in our sample. The contributions of slash and WNh, WR, O, B and A stars are shown. The blue shaded areas are bootstrapped ±1σ estimates (Sect. 2.2) and the numbers along the curves indicate the cumulative number of stars up to certain ages and masses to judge which features of the distributions are populated by how many stars. The age distribution beyond 10 Myr keeps dropping and is essentially zero after ≈40 Myr. In panel b, a power-law mass-function, ζ(M) = dp/dM ∝ M−α, is fitted to the mass distribution and the inferred high-mass IMF slope γ>15 after correcting for those stars that already ended their nuclear burning lifetime is also provided (see Sect. 3.4). For reference, a Salpeter IMF has a power-law slope of γ = 2.35 (Salpeter 1955).
Current usage metrics show cumulative count of Article Views (full-text article views including HTML views, PDF and ePub downloads, according to the available data) and Abstracts Views on Vision4Press platform.
Data correspond to usage on the plateform after 2015. The current usage metrics is available 48-96 hours after online publication and is updated daily on week days.
Initial download of the metrics may take a while.