Fig. 1.
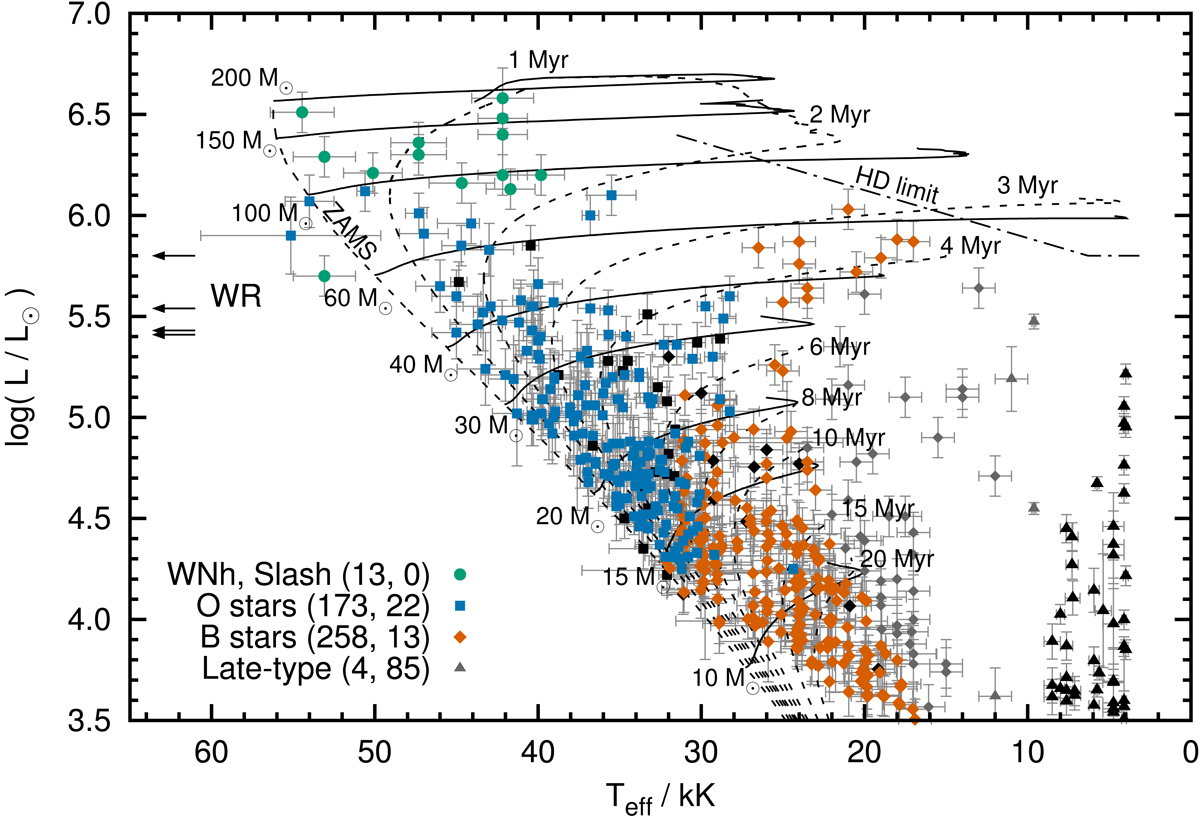
Hertzsprung–Russell diagram of the VFTS stars analysed in this paper. The solid and dashed black lines are the non-rotating stellar evolutionary tracks and isochrones of Brott et al. (2011) and Köhler et al. (2015), respectively. The Humphreys–Davidson (HD) limit is shown by the dot-dashed line in the top-right}. Black symbols represent stars which cannot be reproduced by the stellar models (for reference, stars cooler than 9000 K and hence removed from our sample are also shown in black). In the legend, we provide the number of stars of each class that are in our final sample and those where not all observables can be reproduced by the stellar models simultaneously in parenthesis. Symbols in grey denote stars that fall off the MS part of the stellar tracks and are hence treated as Hertzsprung-gap stars (Sect. 2.1), but the symbols themselves keep their meaning. The luminosities of the four classical WR stars in our sample are indicated by the arrows on the left (they have surface temperatures of 80–90 kK).
Current usage metrics show cumulative count of Article Views (full-text article views including HTML views, PDF and ePub downloads, according to the available data) and Abstracts Views on Vision4Press platform.
Data correspond to usage on the plateform after 2015. The current usage metrics is available 48-96 hours after online publication and is updated daily on week days.
Initial download of the metrics may take a while.