Fig. 8.
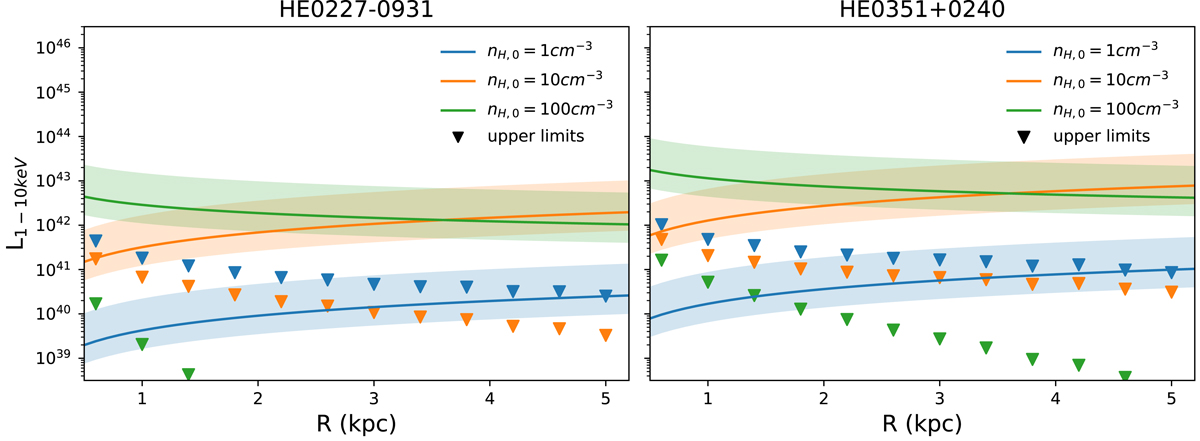
Prediction for X-ray bubble luminosity as a function of shock-front radius for three values of the interstellar gas density at R = 100 pc (nH, 0) from the analytic model in Nims et al. (2015), assuming nH ∝ R
−1 (solid lines), compared to the upper limits from our observations (solid triangles). Different upper limits are shown because the predicted wind spectrum depends on density. The errors on the prediction come from bolometric correction uncertainty (![]() ) when scaling to the bolometric luminosities of HE 0227–0913 and HE 0351+0240. Except for the lowest densities, our upper limits fall below the prediction.
) when scaling to the bolometric luminosities of HE 0227–0913 and HE 0351+0240. Except for the lowest densities, our upper limits fall below the prediction.
Current usage metrics show cumulative count of Article Views (full-text article views including HTML views, PDF and ePub downloads, according to the available data) and Abstracts Views on Vision4Press platform.
Data correspond to usage on the plateform after 2015. The current usage metrics is available 48-96 hours after online publication and is updated daily on week days.
Initial download of the metrics may take a while.