Fig. 6.
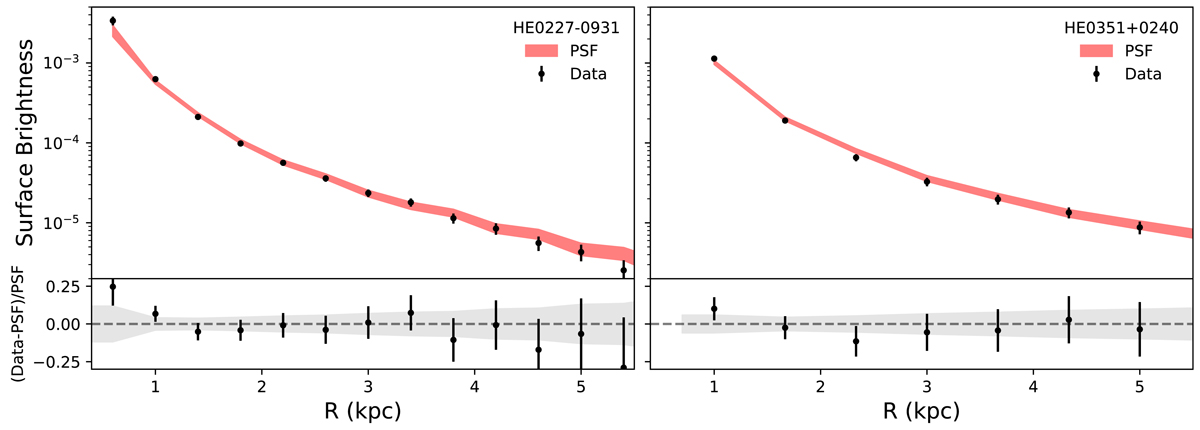
Radial profiles of the background-subtracted data (black cirlces) and of the simulated PSF (red lines) in bins of 1″, shown with 95% level errors. Both 0.5–7 keV data and PSF were used, excluding the readout streak regions. Bottom panels: fractional residual errors. No clear evidence for extended emission is detected for either galaxy.
Current usage metrics show cumulative count of Article Views (full-text article views including HTML views, PDF and ePub downloads, according to the available data) and Abstracts Views on Vision4Press platform.
Data correspond to usage on the plateform after 2015. The current usage metrics is available 48-96 hours after online publication and is updated daily on week days.
Initial download of the metrics may take a while.