Fig. 5.
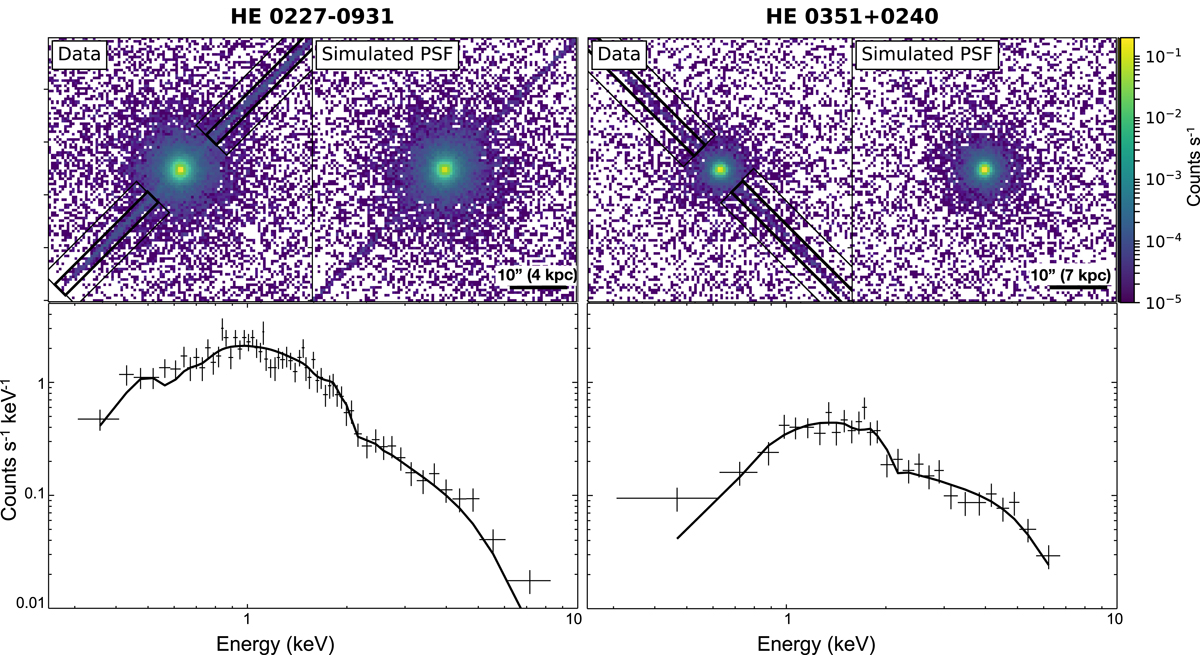
Top: coadded Chandra images of HE 0227–0931 and HE 0351+0240 (with readout streaks) and the corresponding simulated PSFs. The color scale is in units of counts per second, shown by the right-hand colorbar. Bottom: spectra of the co-added, background subtracted point sources taken from the readout streaks (shown in the thick black regions above, with adjacent background regions), binned to have a minimum significance of 5 per bin. The spectra were fit to a single power-law, with the xspec model: (phabs*powlaw1d). In each model we fixed Galactic absorption to the value reported in XSPEC, 3.26 × 1020 cm−2 for HE 0227–0913 and 1.28 × 1021 cm−2 for HE 0351+0240. The best-fit models (solid black lines) were used to simulate the PSFs (shown above).
Current usage metrics show cumulative count of Article Views (full-text article views including HTML views, PDF and ePub downloads, according to the available data) and Abstracts Views on Vision4Press platform.
Data correspond to usage on the plateform after 2015. The current usage metrics is available 48-96 hours after online publication and is updated daily on week days.
Initial download of the metrics may take a while.