Fig. 3.
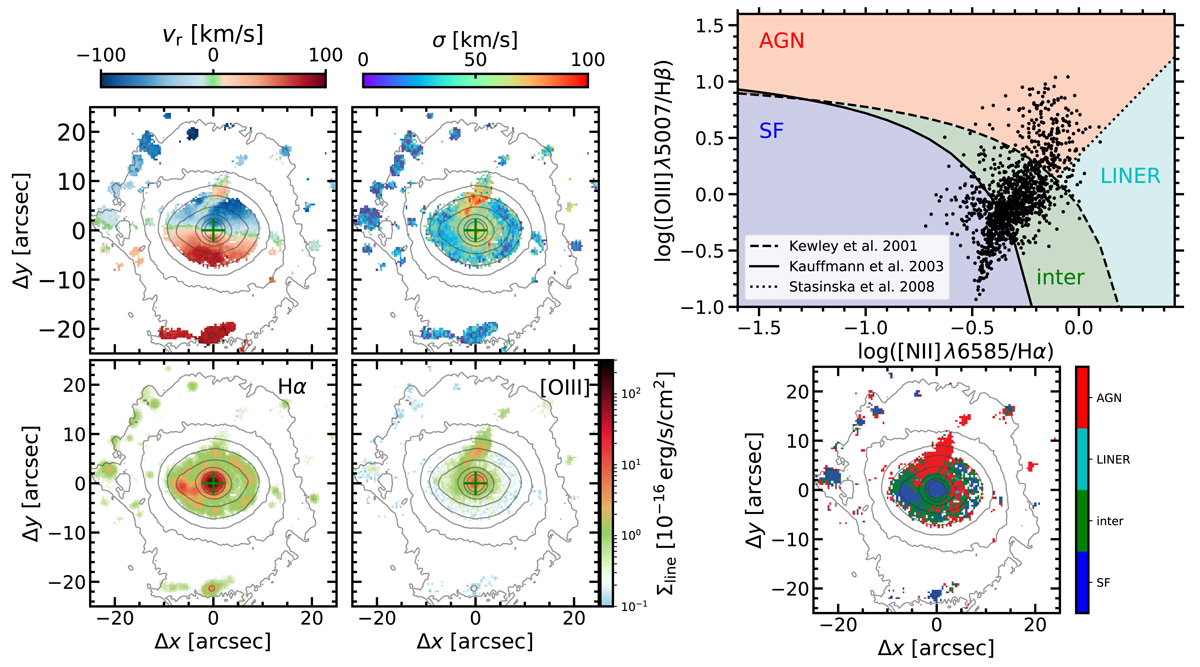
Left panels: ionized gas velocity and velocity dispersion maps (upper panels) for HE 0227–0913 together with the Hα and [O III] surface brightness maps from the MUSE data after stellar continuum subtraction. Contours of the continuum emission are in logarithmic scaling are overlayed in gray. Right panels: emission-line diagnostic diagram for spaxels with a S/N > 3 in each line (upper panel). Excitation map after separating line ratios, into star forming, AGN, intermediate and LINER-like ionization.
Current usage metrics show cumulative count of Article Views (full-text article views including HTML views, PDF and ePub downloads, according to the available data) and Abstracts Views on Vision4Press platform.
Data correspond to usage on the plateform after 2015. The current usage metrics is available 48-96 hours after online publication and is updated daily on week days.
Initial download of the metrics may take a while.