Fig. 6.
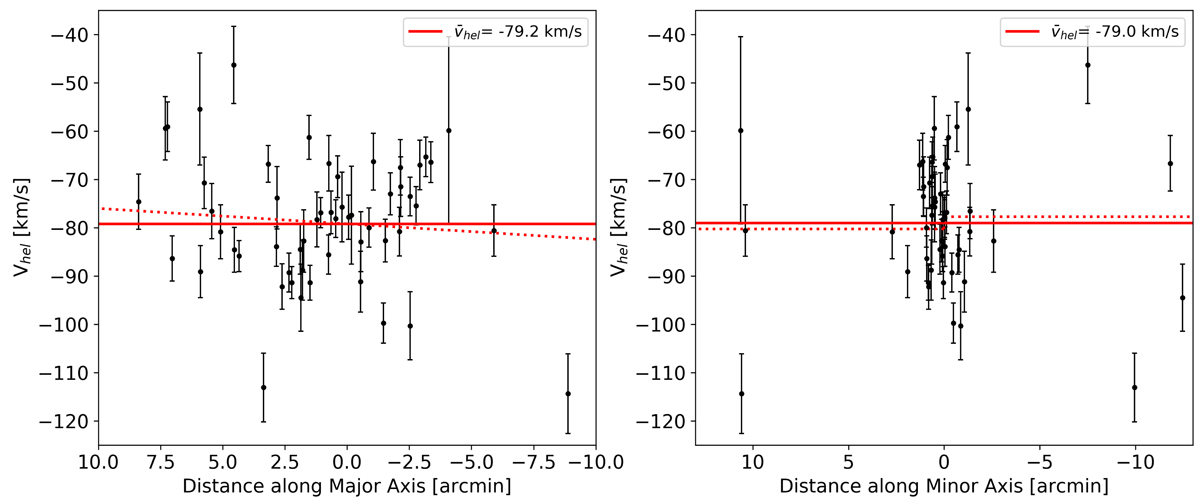
Line-of-sight velocity distributions of the probable members. Left panel: along the optical major axis, with the systemic velocity (solid line) and the rotational component (dotted line) resulting from MultiNest run using the linear rotation model overplotted; right panel: along the minor axis, with the systemic velocity (solid line) and the rotational component (dotted line) resulting from MultiNest run using the flat rotation model overplotted. As can be seen from both panels the rotational component is negligible.
Current usage metrics show cumulative count of Article Views (full-text article views including HTML views, PDF and ePub downloads, according to the available data) and Abstracts Views on Vision4Press platform.
Data correspond to usage on the plateform after 2015. The current usage metrics is available 48-96 hours after online publication and is updated daily on week days.
Initial download of the metrics may take a while.