Fig. 4.
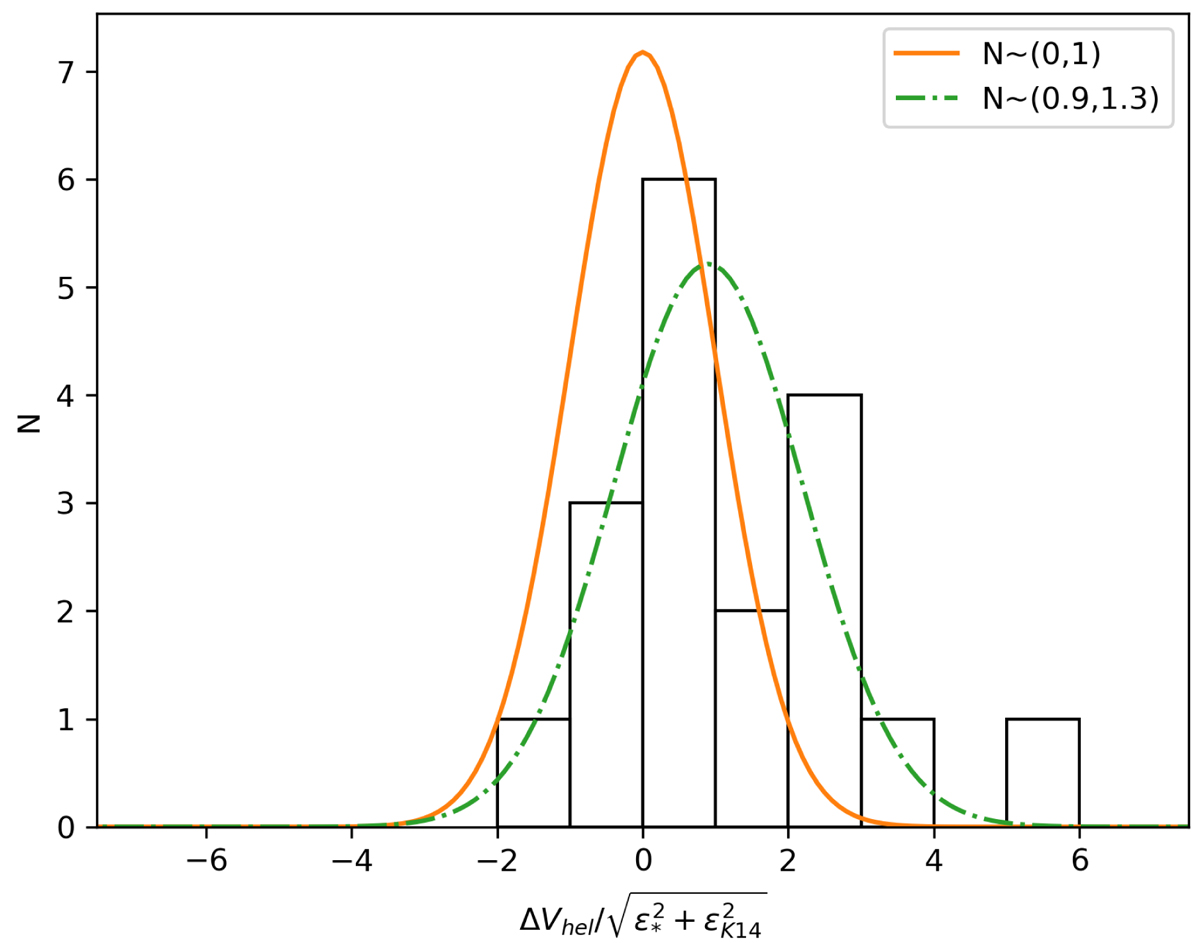
Distribution of velocity differences for stars in common between our dataset and that of Kirby et al. (2014). A normal distribution with mean and standard deviation N( μ, σ)∼(0, 1) is overplotted for direct comparison (continuous line), together with a normal distribution N( μ, σ) ∼ (0.9, 1.3) (dot-dashed line) fitted to the velocity differences after discarding the most deviant measurement.
Current usage metrics show cumulative count of Article Views (full-text article views including HTML views, PDF and ePub downloads, according to the available data) and Abstracts Views on Vision4Press platform.
Data correspond to usage on the plateform after 2015. The current usage metrics is available 48-96 hours after online publication and is updated daily on week days.
Initial download of the metrics may take a while.