Fig. 2.
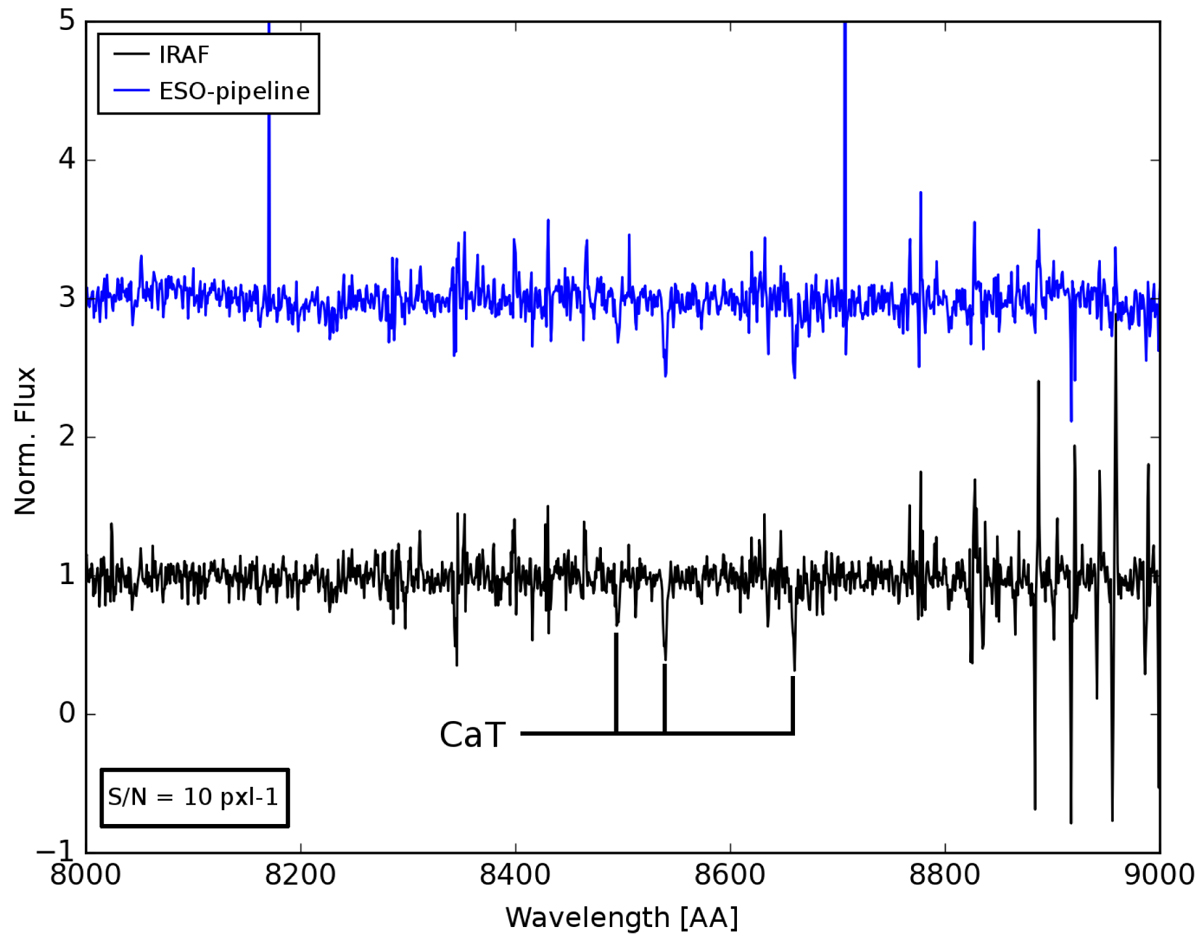
Example of output single-exposure normalized spectra obtained using the ESO-pipeline (upper blue spectrum) vs. IRAF tasks (lower black spectrum), for the same target star. The two spectra were offset on purpose for direct comparison. Although the IRAF reduced spectrum presents higher residual at redder wavelengths (where we note the presence of a telluric absorption band), around the CaT it turned out to be cleaner and less noisy than the ESO-pipeline reduced one.
Current usage metrics show cumulative count of Article Views (full-text article views including HTML views, PDF and ePub downloads, according to the available data) and Abstracts Views on Vision4Press platform.
Data correspond to usage on the plateform after 2015. The current usage metrics is available 48-96 hours after online publication and is updated daily on week days.
Initial download of the metrics may take a while.