Fig. 1.
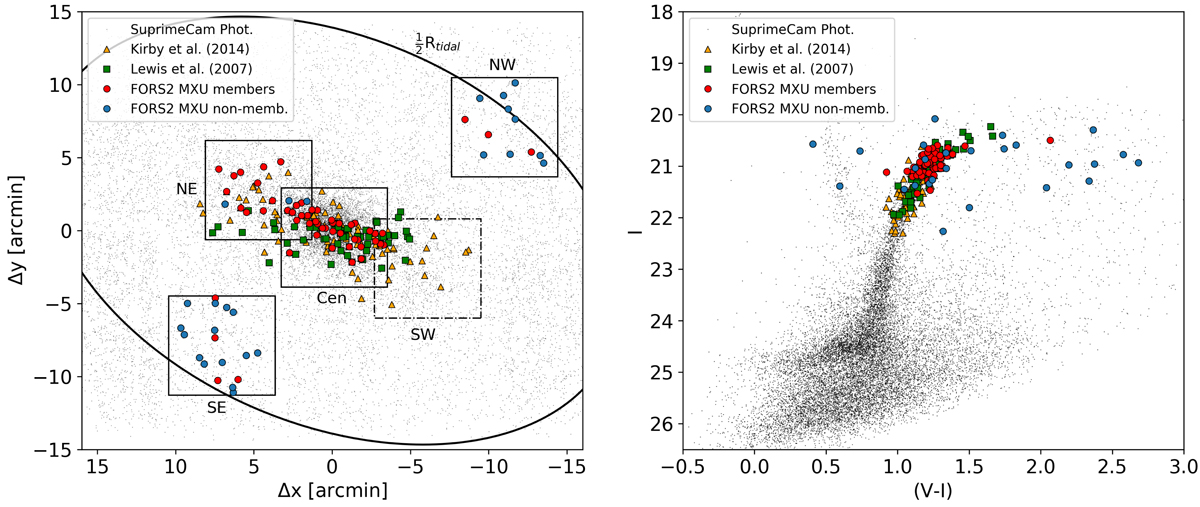
Spatial distribution (left) and color-magnitude diagram (right) of stars along the line-of-sight to the Cetus dSph. Black points represent the objects classified as stars in the Subaru/SuprimeCam photometric data (see main text); FORS2 MXU targets classified as members are marked with red dots, while the non-members are marked with blue dots. The large squares indicate the 4 observed FORS2 pointings, together with the not-observed SW pointing marked as a dot-dashed box. The ellipse indicates the galaxy half tidal radius. Overplotted are also spectroscopic targets classified as probable members in Kirby et al. (2014; orange triangles) and Lewis et al. (2007; green squares).
Current usage metrics show cumulative count of Article Views (full-text article views including HTML views, PDF and ePub downloads, according to the available data) and Abstracts Views on Vision4Press platform.
Data correspond to usage on the plateform after 2015. The current usage metrics is available 48-96 hours after online publication and is updated daily on week days.
Initial download of the metrics may take a while.