Fig. 9.
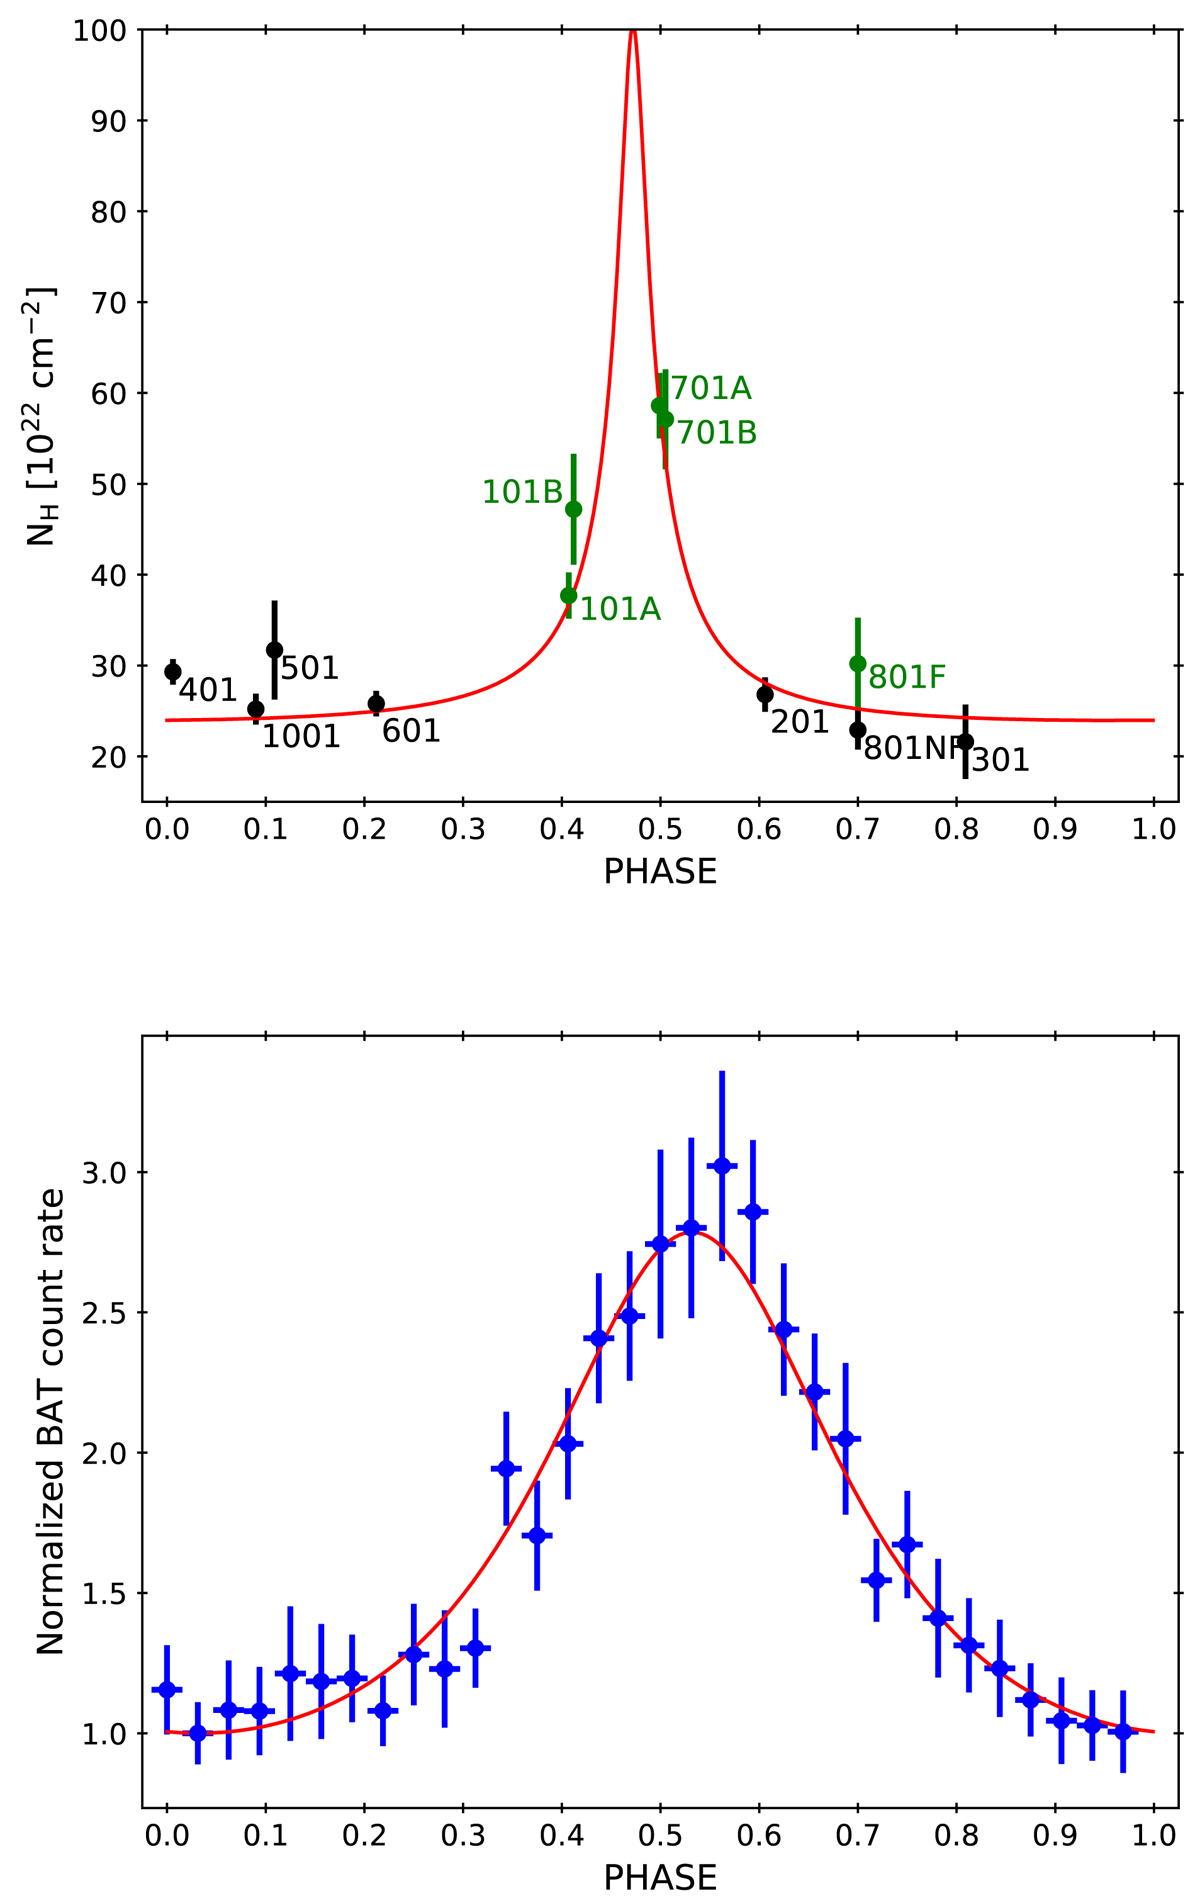
Orbital evolution of IGR J16320–4751. Upper panel: intrinsic absorption column density, NH, obtained from XMM-Newton spectral fitting. Error bars correspond to the 90% confidence level. Lower panel: folded Swift/BAT light curve normalized by its minimum value. Error bars correspond to the 1-σ confidence level. Red lines are the absorption column density and normalized local density of our simple wind model scenario obtained for the parameters indicated in the text.
Current usage metrics show cumulative count of Article Views (full-text article views including HTML views, PDF and ePub downloads, according to the available data) and Abstracts Views on Vision4Press platform.
Data correspond to usage on the plateform after 2015. The current usage metrics is available 48-96 hours after online publication and is updated daily on week days.
Initial download of the metrics may take a while.