Fig. 4.
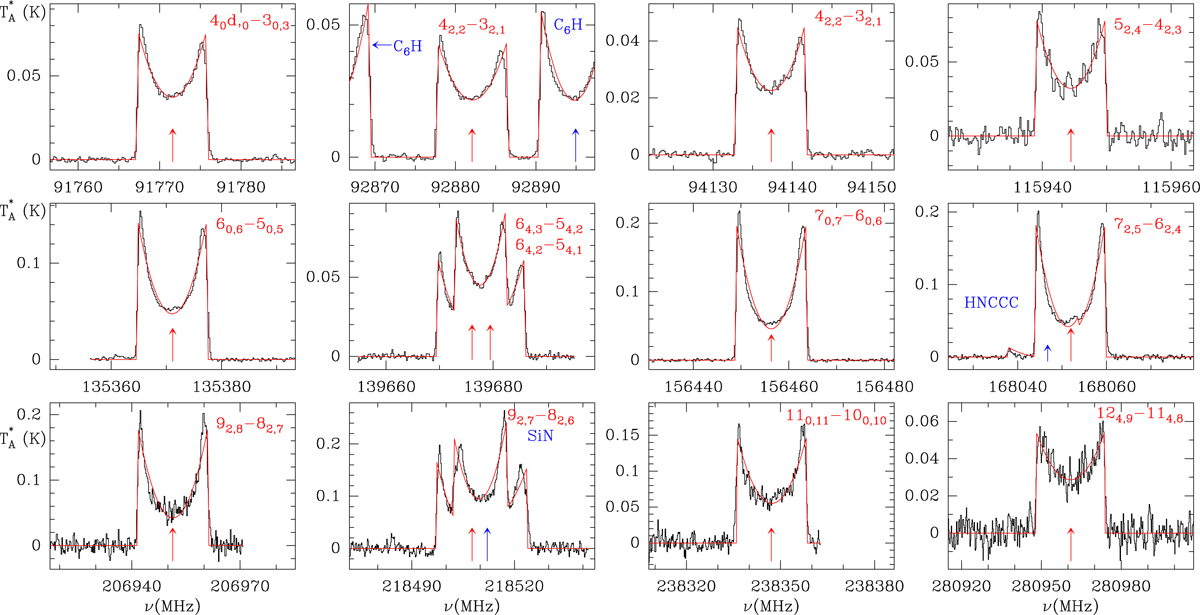
Selected lines of 29SiC2 observed with the new FTS spectrometers installed in the IRAM 30 m telescope after 2010. Red lines show the fit to the observed rotational transitions. The quantum numbers of each transition are indicated at the top-right corner of each panel. Vertical red arrows indicate the fitted frequencies for these transitions. Features from other species are indicated in blue. The sharp edges of the 29SiC2 line profiles allow to derive accurate frequencies for these rotational transitions. Measured and fitted frequencies for this isotopologue of SiC2 are given in Table A.5.
Current usage metrics show cumulative count of Article Views (full-text article views including HTML views, PDF and ePub downloads, according to the available data) and Abstracts Views on Vision4Press platform.
Data correspond to usage on the plateform after 2015. The current usage metrics is available 48-96 hours after online publication and is updated daily on week days.
Initial download of the metrics may take a while.