Fig. 3.
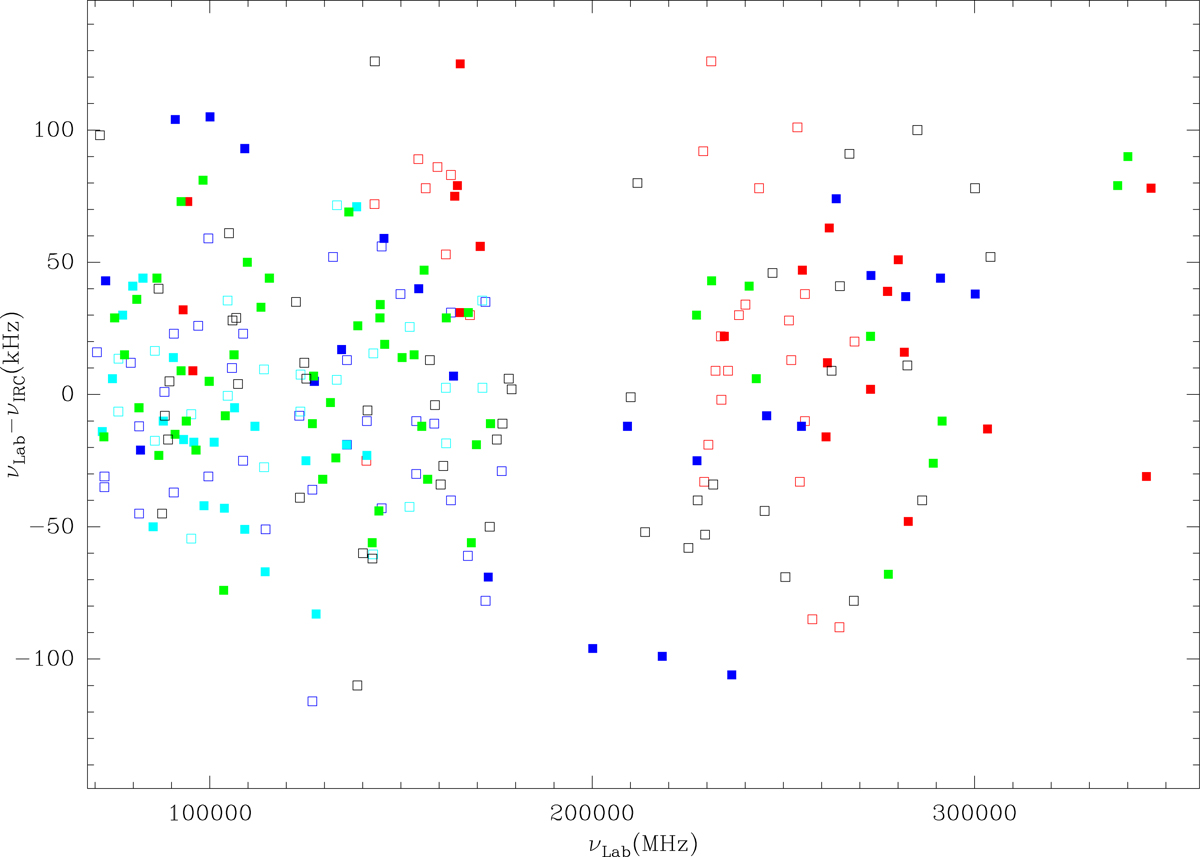
Laboratory frequencies (or predicted frequencies from laboratory data) minus observed frequencies in IRC +10216 (in kHz) as a function of the frequency of the lines. The different symbols correspond to the following molecules: SiC2 (red filled squares); 29SiC2 and 30SiC2 (red empty squares); HC3N (blue filled squares); the three 13C isotopologues of HC3N (blue empty squares); HC5N (cyan filled squares); C4H (cyan empty squares); 13CS, C34S, C33S, 13C34S, CCS, and CCCS (green filled squares); 29SiS, 30SiS, Si34S, Si33S, and 29Si34S (black empty squares).
Current usage metrics show cumulative count of Article Views (full-text article views including HTML views, PDF and ePub downloads, according to the available data) and Abstracts Views on Vision4Press platform.
Data correspond to usage on the plateform after 2015. The current usage metrics is available 48-96 hours after online publication and is updated daily on week days.
Initial download of the metrics may take a while.