Fig. C.1
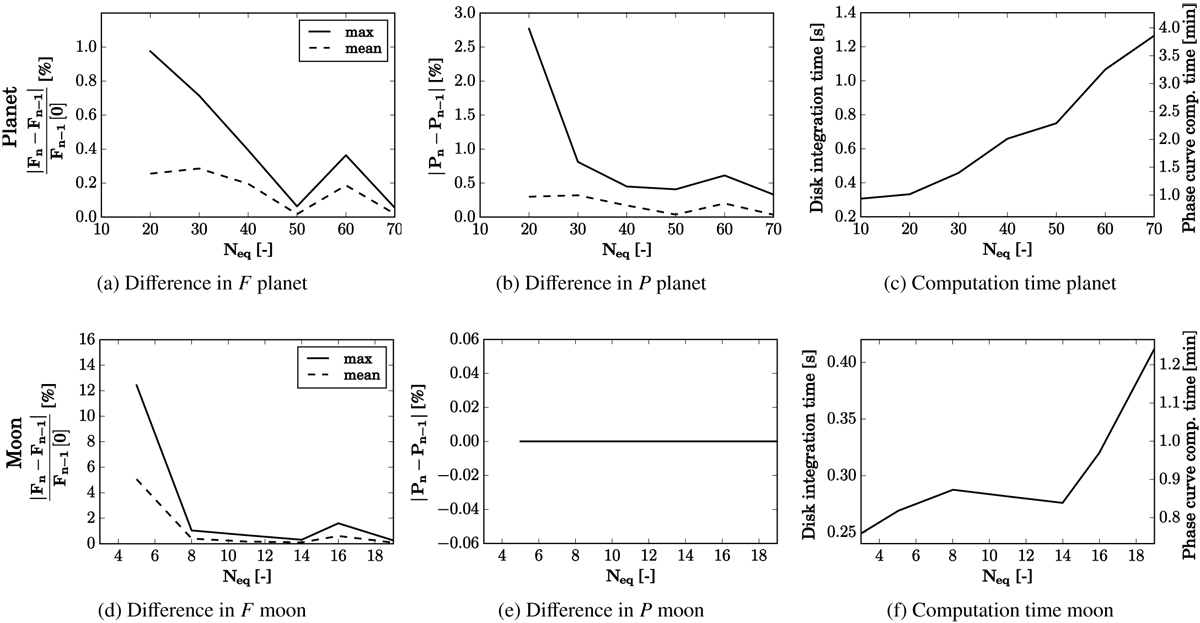
Analysis for the number of pixels along the equator Neq of the planet (top panels) and moon (bottom panels). Shown are the maximum (solid line) and mean (dashed line) differences between results computed across the whole phase angle range and for consecutive values of Neq values, for the reflected flux F(α) relative to F(α = 0°) (panels a and d), and degree of polarization P (panels b and e, note that for the moon, P = 0). Also shown is the computational time (in minutes) for the computation of a full phase curve (with 24 h temporal resolution) and the average disk integration (panels c and f). For ![]() (top panels), we used values of 10, 20, 30, 40, 50, 60, and 70, and for
(top panels), we used values of 10, 20, 30, 40, 50, 60, and 70, and for ![]() (bottom panels), 3, 5, 8, 11, 14, 16, and 19.
(bottom panels), 3, 5, 8, 11, 14, 16, and 19.
Current usage metrics show cumulative count of Article Views (full-text article views including HTML views, PDF and ePub downloads, according to the available data) and Abstracts Views on Vision4Press platform.
Data correspond to usage on the plateform after 2015. The current usage metrics is available 48-96 hours after online publication and is updated daily on week days.
Initial download of the metrics may take a while.