Fig. 1.
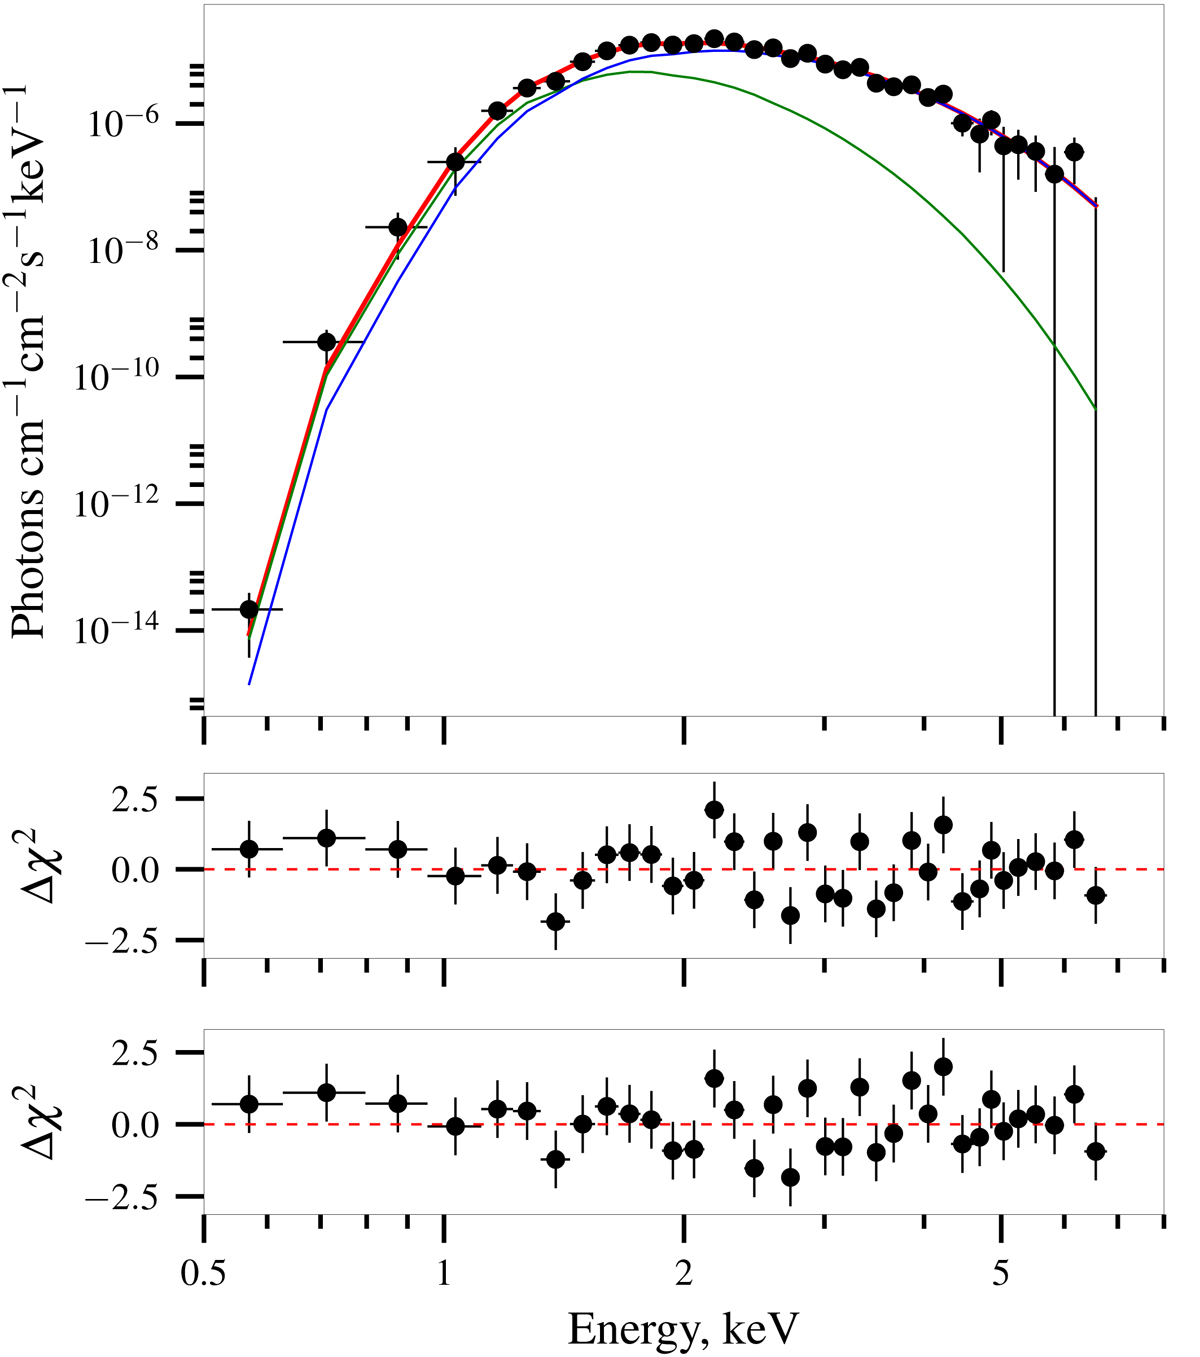
Best-fit unfolded spectrum (top panel) and residuals for the two-component hydrogen atmosphere (middle panel) and carbon models (bottom panel). Only the EPIC PN spectrum from observation 0742050101 is shown for clarity. The contribution of the cold and hot components to the two-component fit is shown with thin lines. The total model flux is indistinguishable for the two models and is shown with the thick red line.
Current usage metrics show cumulative count of Article Views (full-text article views including HTML views, PDF and ePub downloads, according to the available data) and Abstracts Views on Vision4Press platform.
Data correspond to usage on the plateform after 2015. The current usage metrics is available 48-96 hours after online publication and is updated daily on week days.
Initial download of the metrics may take a while.