Fig. 1.
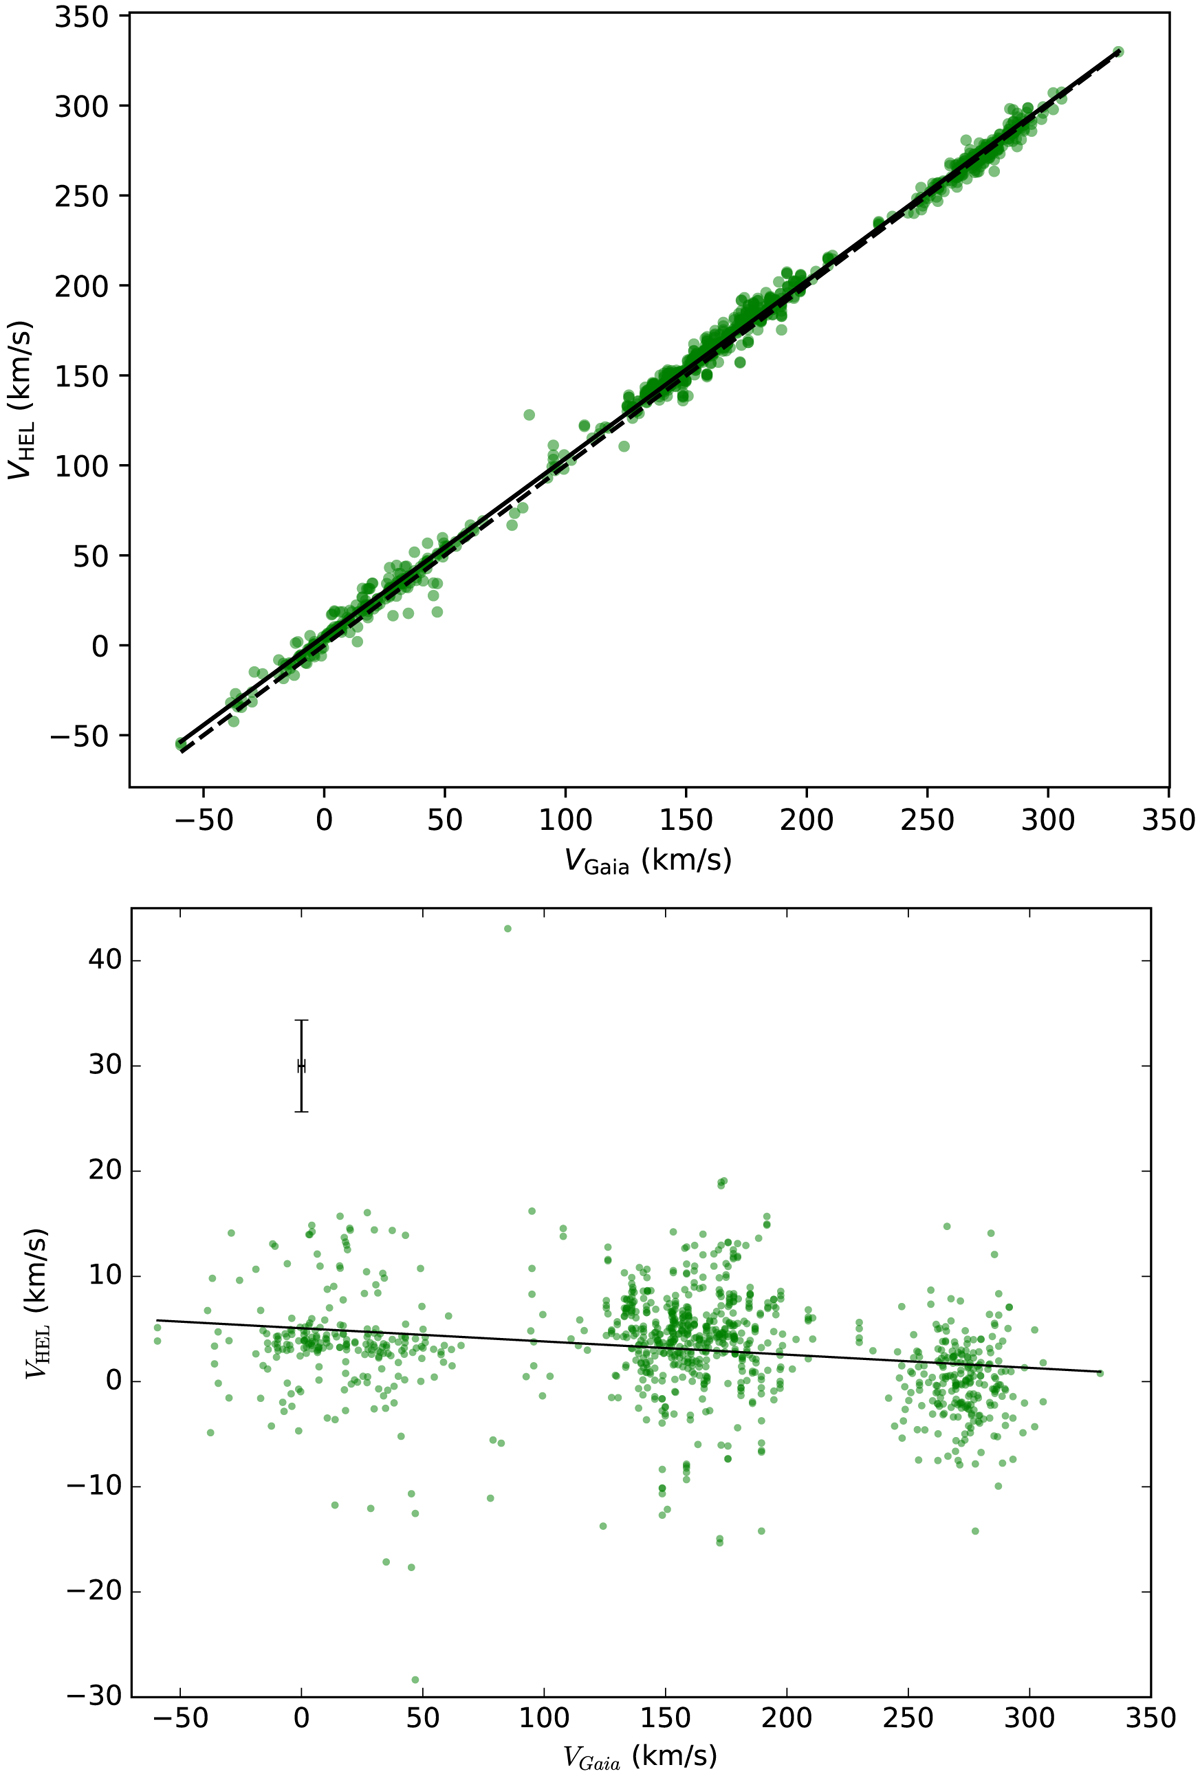
Comparison between radial velocities from Gaia (VGaia) for the targets in this catalogue and those obtained through our spectra (VHEL). The individual measurements of stars with several measurements in our catalogue are shown as separate points. Top panel: VGaia vs. VHEL. The dashed line indicate the ratio 1:1, while the solid line is the corresponding to the linear regression ([m ± em]x + [n ± en] = [0.9870 ± 0.0018]x + [5.1 ± 0.3]) regression The error bars are too small to be represented. Bottom panel: VGaia vs. VGaia − VHEL. The solid line corresponds to the linear regression indicated in the top panel. The black cross indicates the average error on the data on each axis.
Current usage metrics show cumulative count of Article Views (full-text article views including HTML views, PDF and ePub downloads, according to the available data) and Abstracts Views on Vision4Press platform.
Data correspond to usage on the plateform after 2015. The current usage metrics is available 48-96 hours after online publication and is updated daily on week days.
Initial download of the metrics may take a while.