Fig. 5.
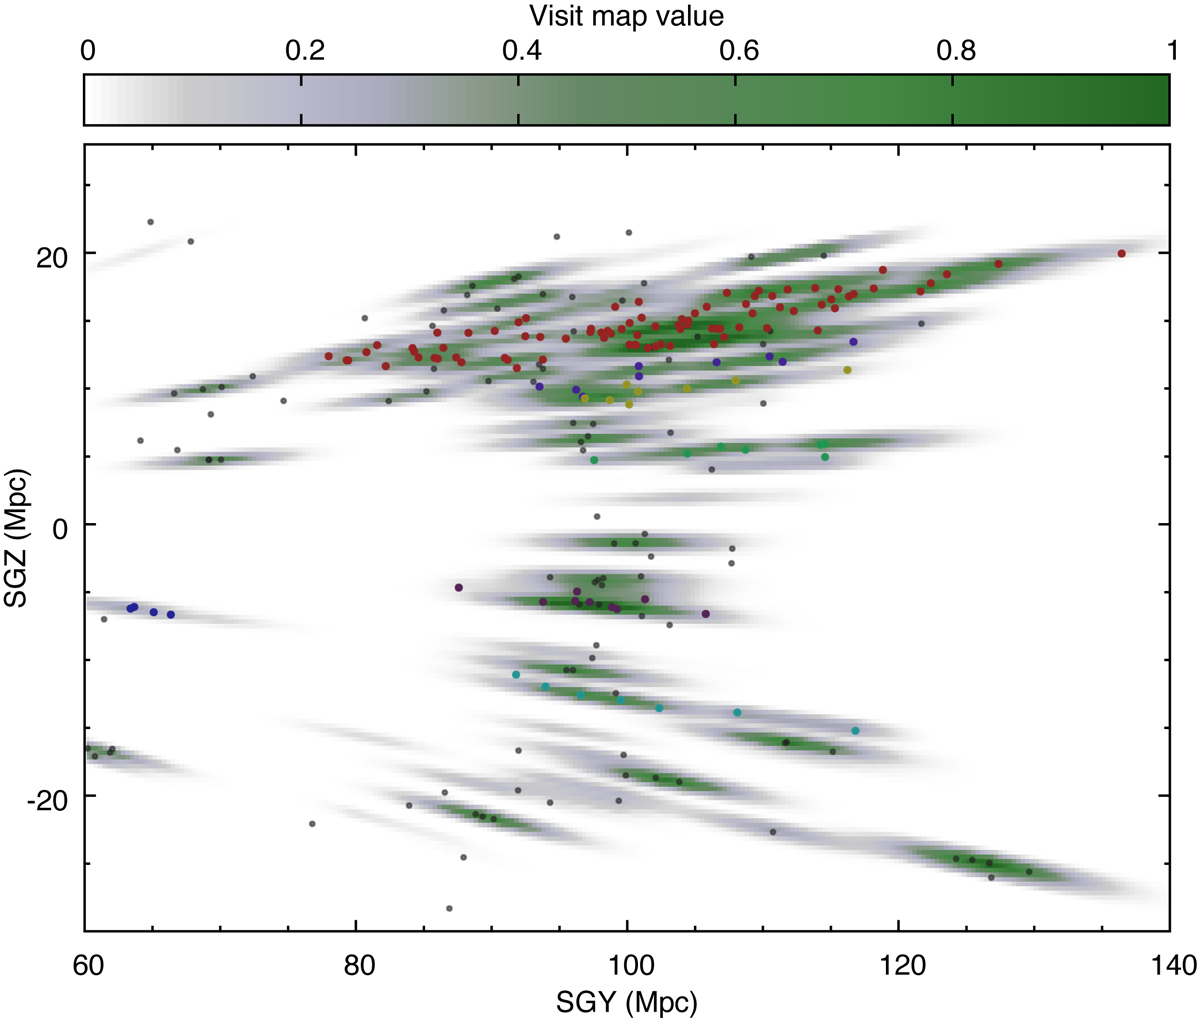
Distribution of galaxies in supergalactic coordinates (points) and the visit map detected using our marked point process. The thickness of the slice is 4 Mpc around SGX = 0. Red points show galaxies in the Coma cluster (see also Fig. 7), other coloured points show galaxies in other groups with at least five members, and grey points show all remaining galaxies. Galaxies are divided into groups as explained in Sect. 3.
Current usage metrics show cumulative count of Article Views (full-text article views including HTML views, PDF and ePub downloads, according to the available data) and Abstracts Views on Vision4Press platform.
Data correspond to usage on the plateform after 2015. The current usage metrics is available 48-96 hours after online publication and is updated daily on week days.
Initial download of the metrics may take a while.