Fig. 4.
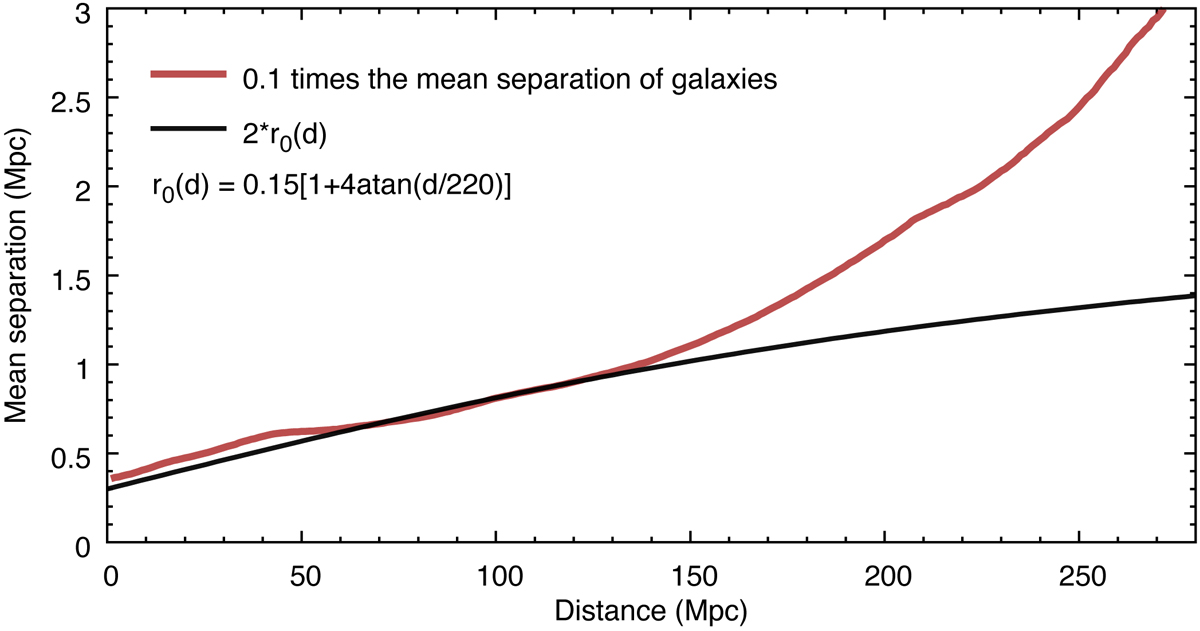
Mean separation between the galaxies as a function of distance from the observer in the 2MRS data set. Red line shows the mean nearest neighbour separation between galaxies (multiplied by 0.1), which is usually taken as the linking length in a FoF algorithm. Black line shows the arctan function that we use to describe the base object radius in our marked point process.
Current usage metrics show cumulative count of Article Views (full-text article views including HTML views, PDF and ePub downloads, according to the available data) and Abstracts Views on Vision4Press platform.
Data correspond to usage on the plateform after 2015. The current usage metrics is available 48-96 hours after online publication and is updated daily on week days.
Initial download of the metrics may take a while.