Fig. A.1.
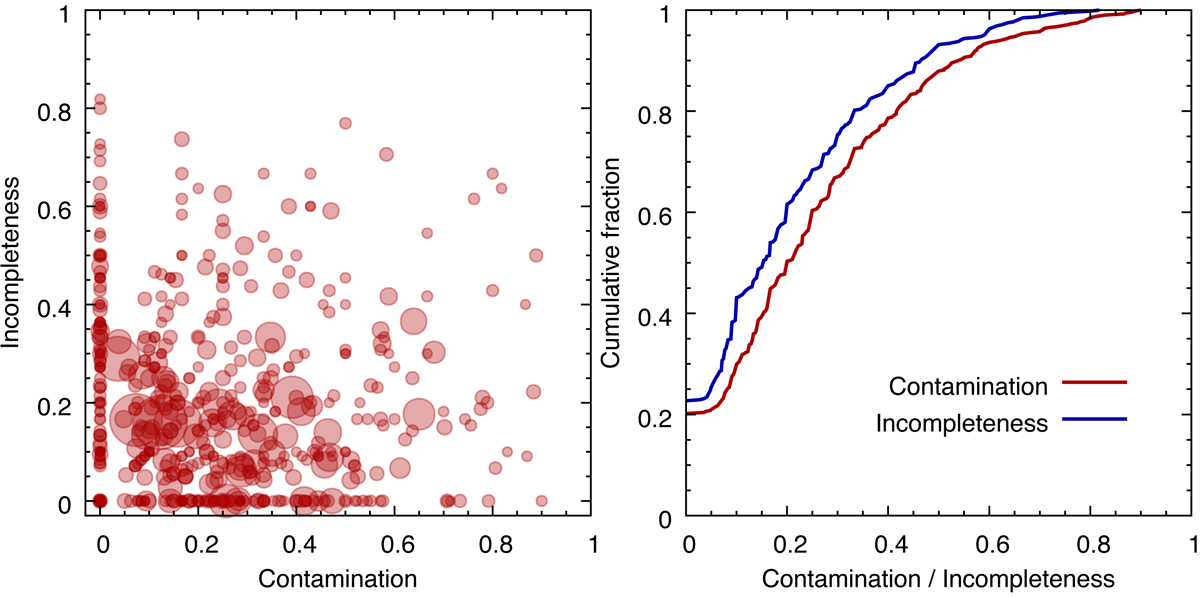
Left panel: contamination versus incompleteness for groups with at least ten members. Point size is proportional to the number of true members in a group. Majority of the large groups and clusters are located in the bottom left corner with low contamination and incompleteness. This figure should be compared with results presented in Wojtak et al. (2018). Right panel: cumulative distribution of contamination and incompleteness for groups shown in the left panel. For about 20 percent of the groups the contamination (red line) or incompleteness (blue line) is exactly zero.
Current usage metrics show cumulative count of Article Views (full-text article views including HTML views, PDF and ePub downloads, according to the available data) and Abstracts Views on Vision4Press platform.
Data correspond to usage on the plateform after 2015. The current usage metrics is available 48-96 hours after online publication and is updated daily on week days.
Initial download of the metrics may take a while.