Fig. 13.
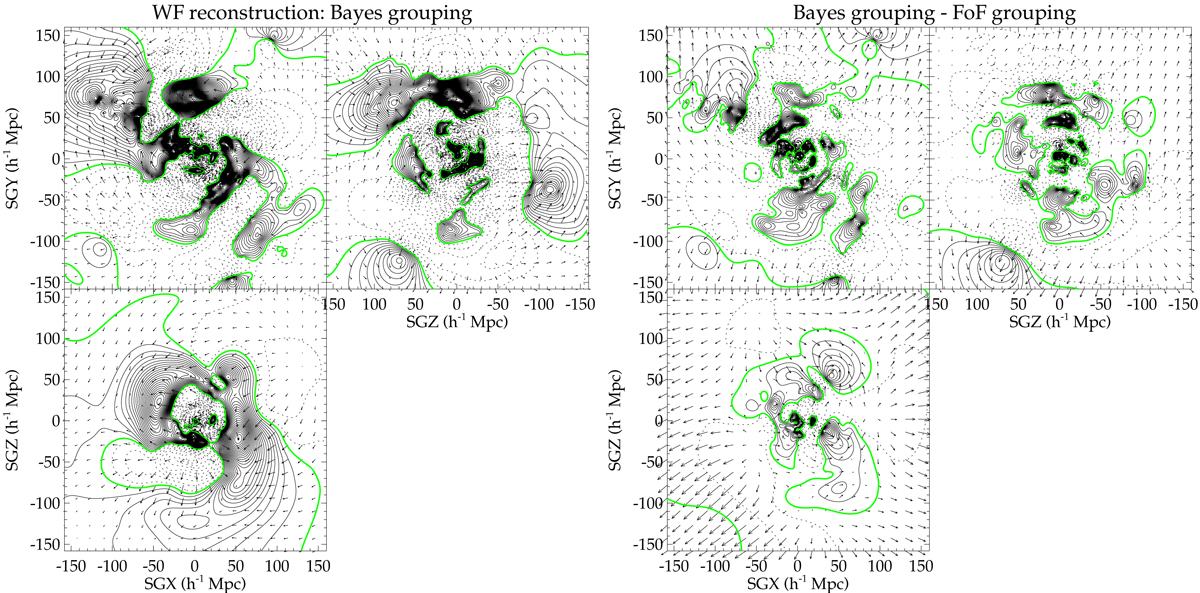
Left-hand panels: supergalactic slices of the reconstructed velocity (arrows) and over-density (contours) fields of the local Universe. The green colour stands for the mean density field, dashed contours are under-density regions while solid contours are over-density regions. Right-hand panels: residual between two reconstructions obtained with Bayesian and FoF grouping schemes. See also Fig. 5 in Sorce & Tempel (2017).
Current usage metrics show cumulative count of Article Views (full-text article views including HTML views, PDF and ePub downloads, according to the available data) and Abstracts Views on Vision4Press platform.
Data correspond to usage on the plateform after 2015. The current usage metrics is available 48-96 hours after online publication and is updated daily on week days.
Initial download of the metrics may take a while.