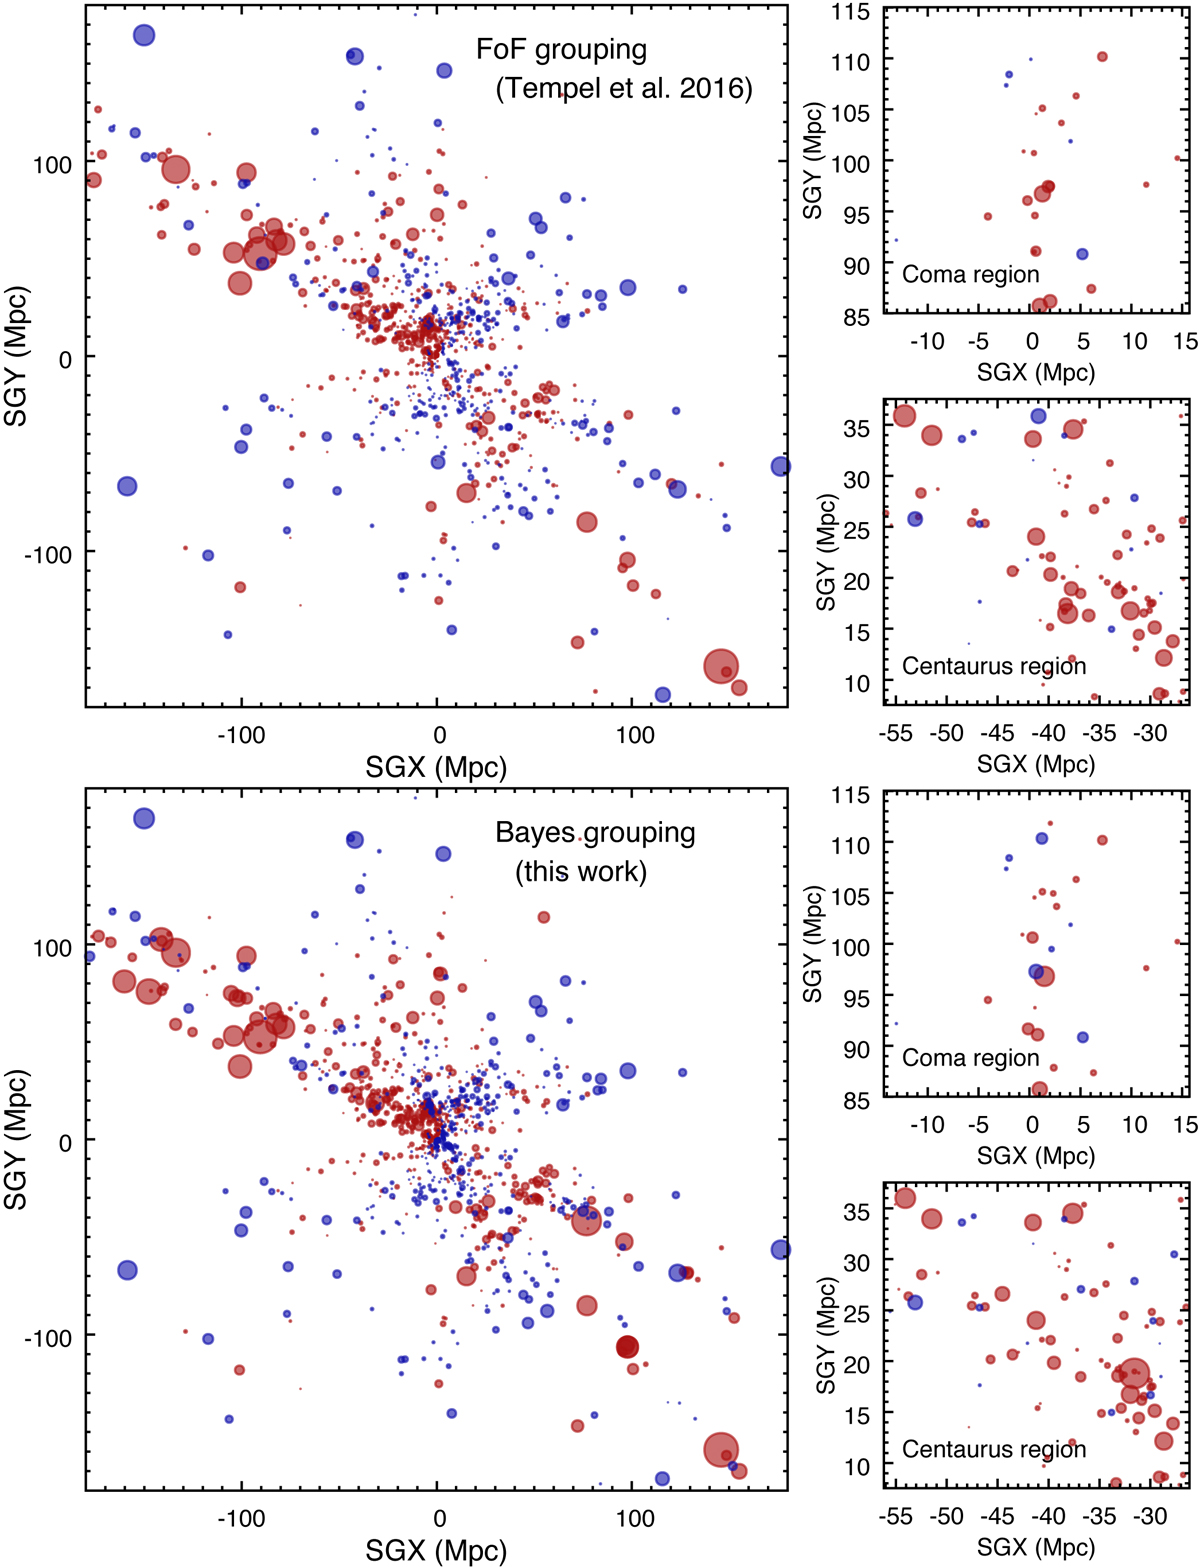
Fig. 12.

Radial peculiar velocities of galaxies in a supergalactic slice with 15 Mpc thickness. Radial peculiar velocities are grouped (averaged) using the groups obtained with a FoF algorithm (upper panels) and the Bayesian group finder (lower panels). A red dot means that the peculiar velocity is positive while a blue dot means that it is negative, the dot size is proportional to the absolute value of the radial peculiar velocity. Smaller panels on the right-hand side show two specific regions, Coma and Centaurus cluster regions, to highlight some of the differences in detail.
Current usage metrics show cumulative count of Article Views (full-text article views including HTML views, PDF and ePub downloads, according to the available data) and Abstracts Views on Vision4Press platform.
Data correspond to usage on the plateform after 2015. The current usage metrics is available 48-96 hours after online publication and is updated daily on week days.
Initial download of the metrics may take a while.


