Fig. 11.
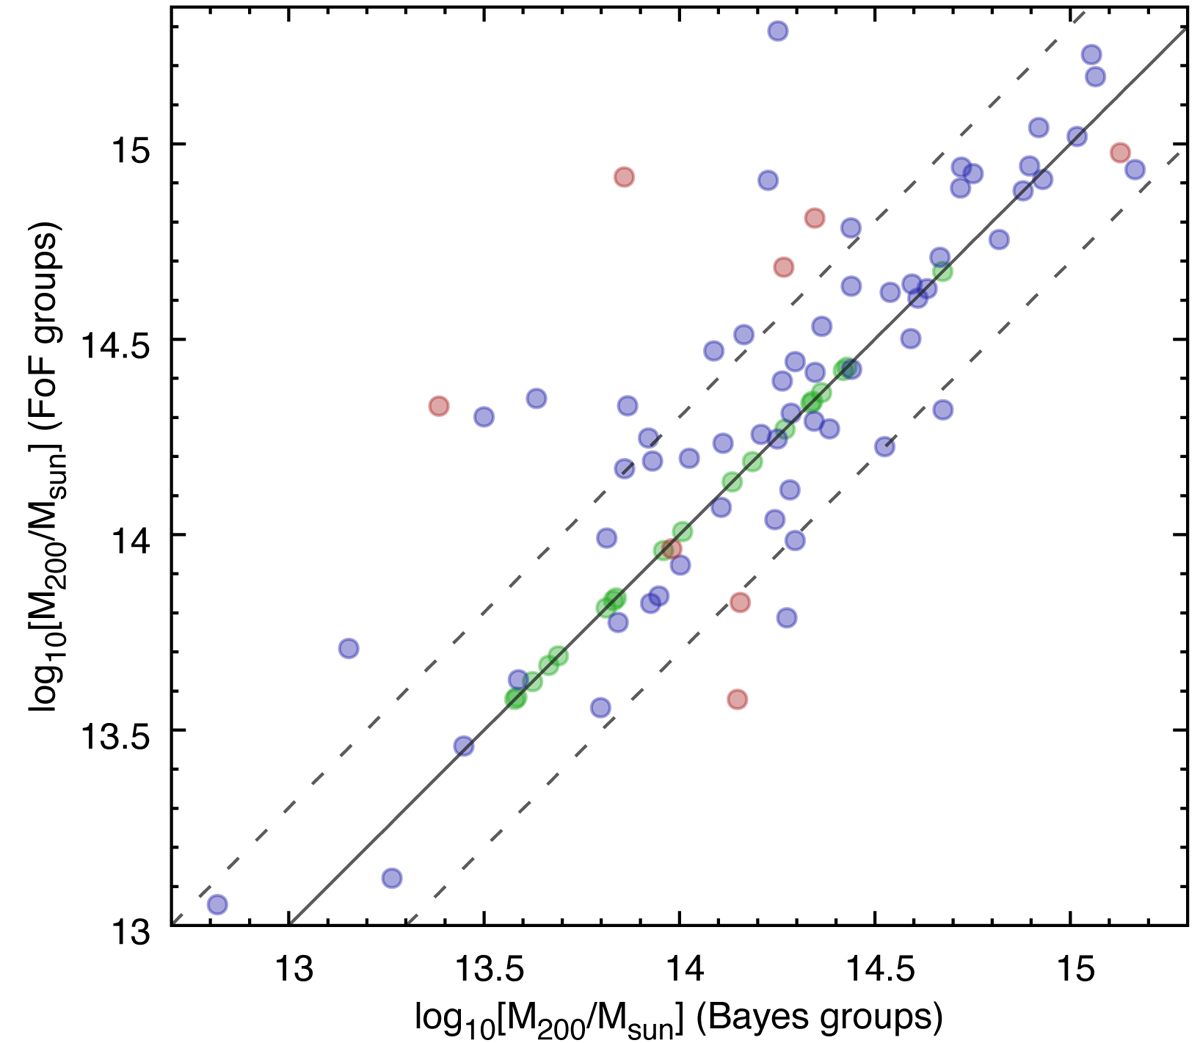
Group masses in Bayes and FoF group catalogues for groups with at least ten galaxies in both catalogues. Green points indicate identical groups, blue ones show groups where at least half of the galaxies are common in FoF and Bayes groups, and red ones are groups that differ significantly. Black line shows the one-to-one relationship and dashed lines indicate the region where mass difference is less than two times.
Current usage metrics show cumulative count of Article Views (full-text article views including HTML views, PDF and ePub downloads, according to the available data) and Abstracts Views on Vision4Press platform.
Data correspond to usage on the plateform after 2015. The current usage metrics is available 48-96 hours after online publication and is updated daily on week days.
Initial download of the metrics may take a while.