Fig. 10.
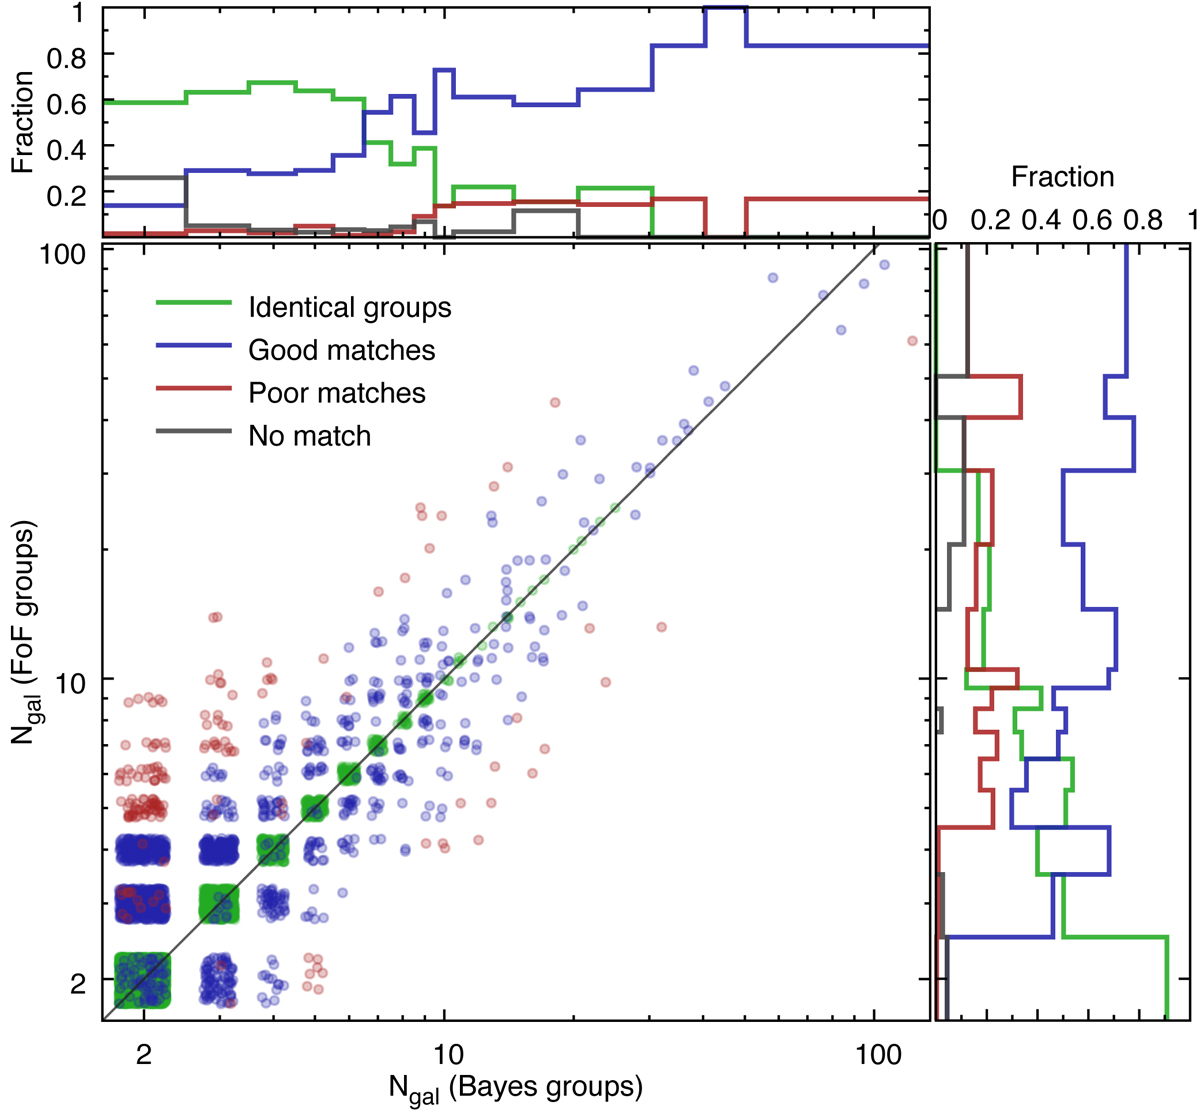
Comparison of group richness (Ngal) in Bayes and FoF groups. Green points indicate identical groups, blue ones show groups where at least half of the galaxies are common in FoF and Bayes groups, and red ones are groups that differ significantly in Bayes and FoF group catalogues. For illustrative purposes, each point have a small random scatter around the true value. Black line shows the one-to-one relationship. Although some of the groups contain the same number of galaxies, they are not identical. Right and upper side panels: fractions as a function of group richness.
Current usage metrics show cumulative count of Article Views (full-text article views including HTML views, PDF and ePub downloads, according to the available data) and Abstracts Views on Vision4Press platform.
Data correspond to usage on the plateform after 2015. The current usage metrics is available 48-96 hours after online publication and is updated daily on week days.
Initial download of the metrics may take a while.