Fig. 17
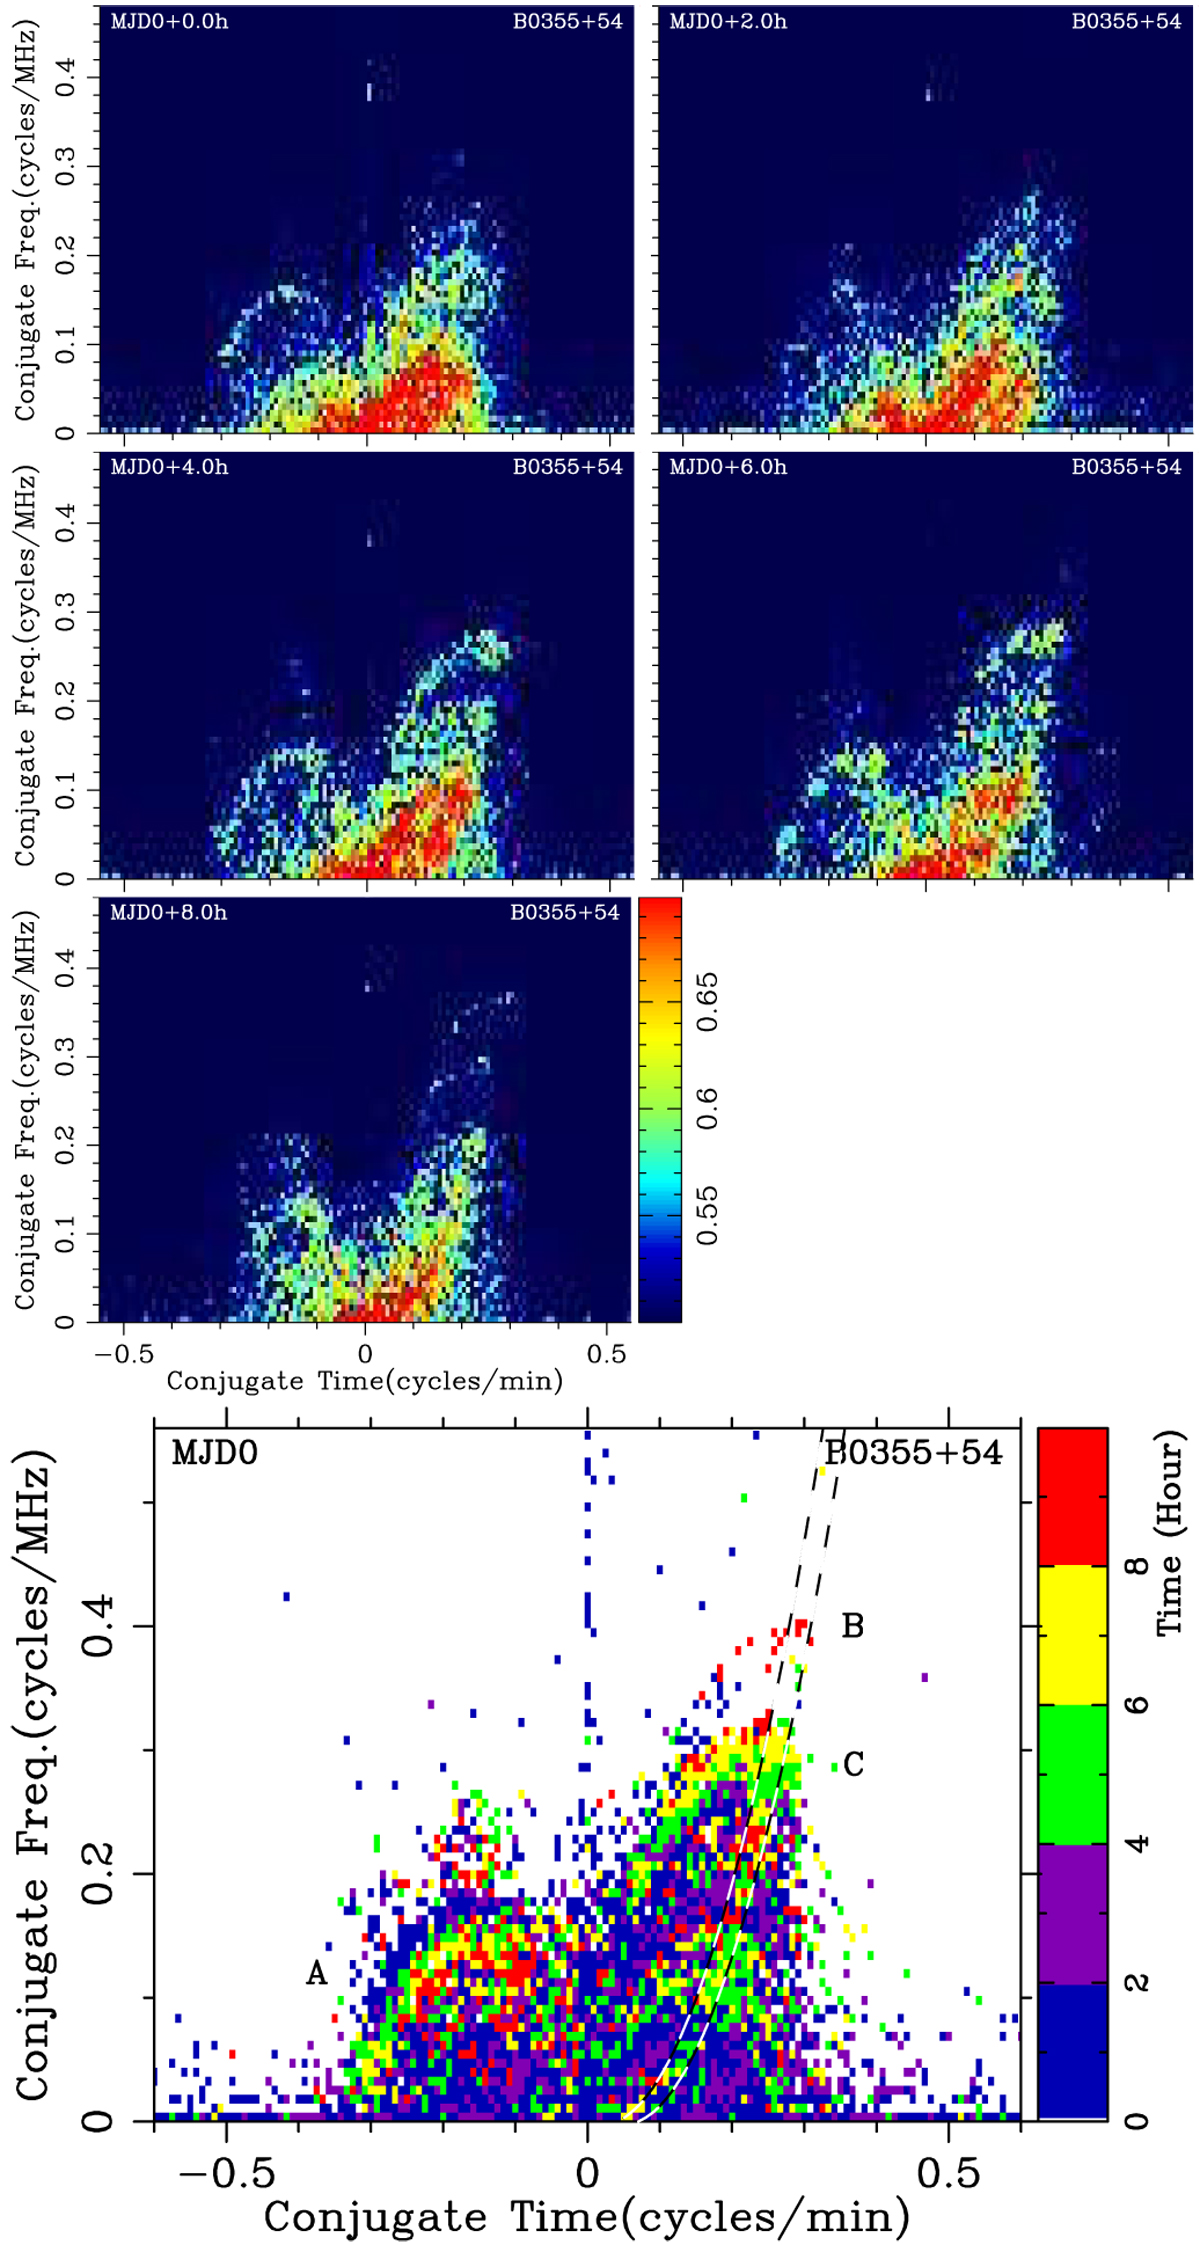
Upper five panels: secondary spectra of PSR B0355+54 for five 2-h blocks of data started at MJD0 = 57416.036 + 105 min, extracted from the 12-h observation session of 57416.036 (see Fig. 2). Bottom panel: evolving secondary spectra plotted only for the maximum power in the five 2-h blocks of data for each pixel. Different color scales are used to mark which block of data was used for the maximum power. Three special inverted arclets are labeled A, B, and C, and the main parabola is indicated by the dashed lines.
Current usage metrics show cumulative count of Article Views (full-text article views including HTML views, PDF and ePub downloads, according to the available data) and Abstracts Views on Vision4Press platform.
Data correspond to usage on the plateform after 2015. The current usage metrics is available 48-96 hours after online publication and is updated daily on week days.
Initial download of the metrics may take a while.