Fig. 12
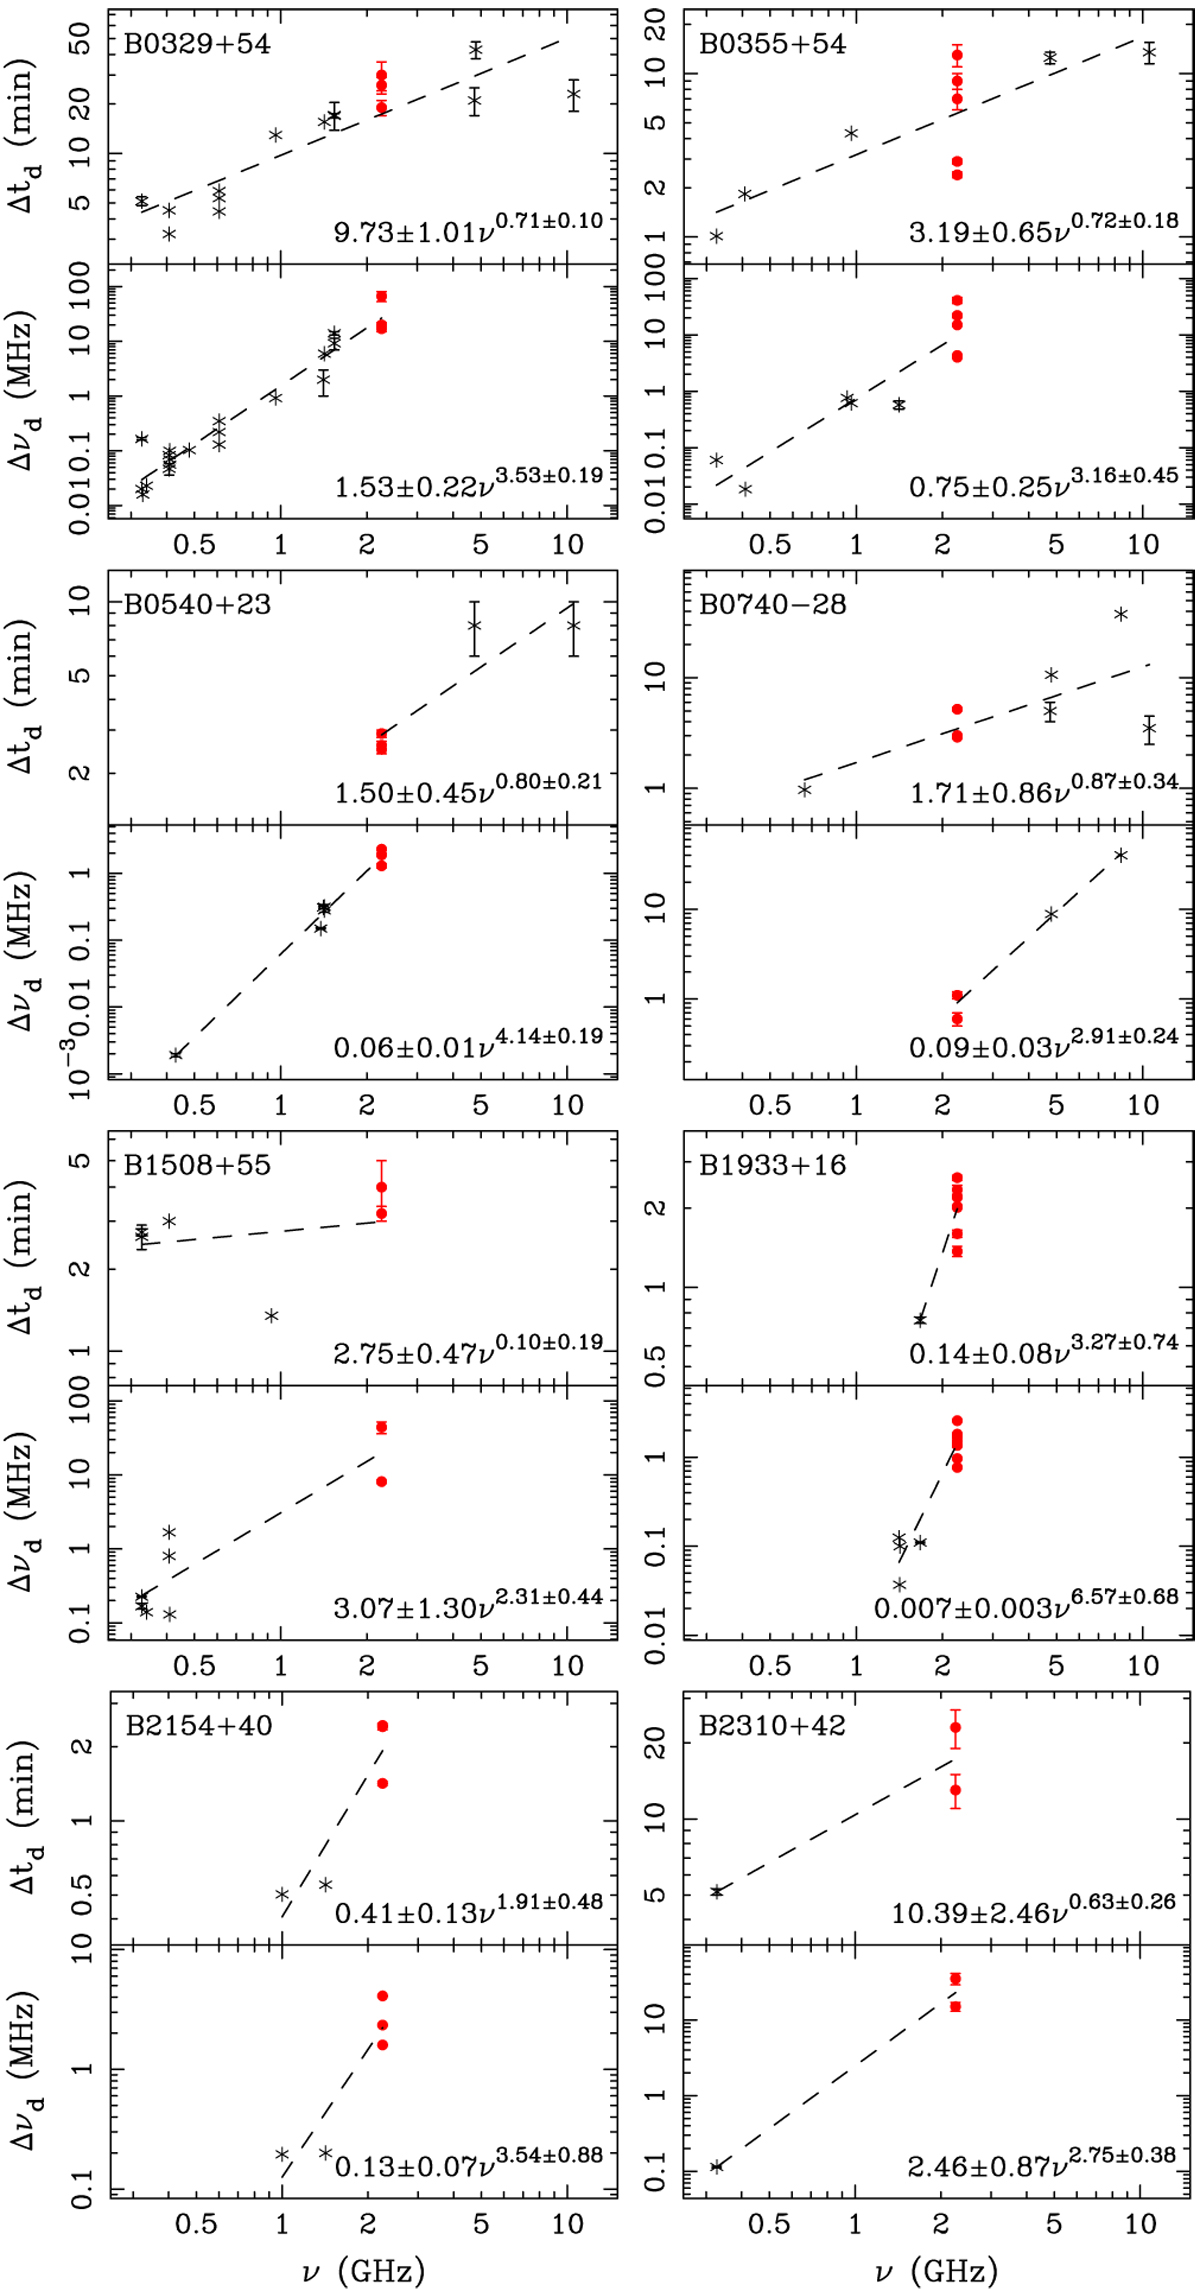
Frequency dependencies of decorrelation bandwidths and scintillation timescales for eight pulsars. Asterisks represent the previous measurements listed in Table 2, and dots are our new measurements as listed in Table 3. The dashed lines represent the best power-law fitting (with uncertainties) as given in the lower right corner of each panel.
Current usage metrics show cumulative count of Article Views (full-text article views including HTML views, PDF and ePub downloads, according to the available data) and Abstracts Views on Vision4Press platform.
Data correspond to usage on the plateform after 2015. The current usage metrics is available 48-96 hours after online publication and is updated daily on week days.
Initial download of the metrics may take a while.