Fig. 1
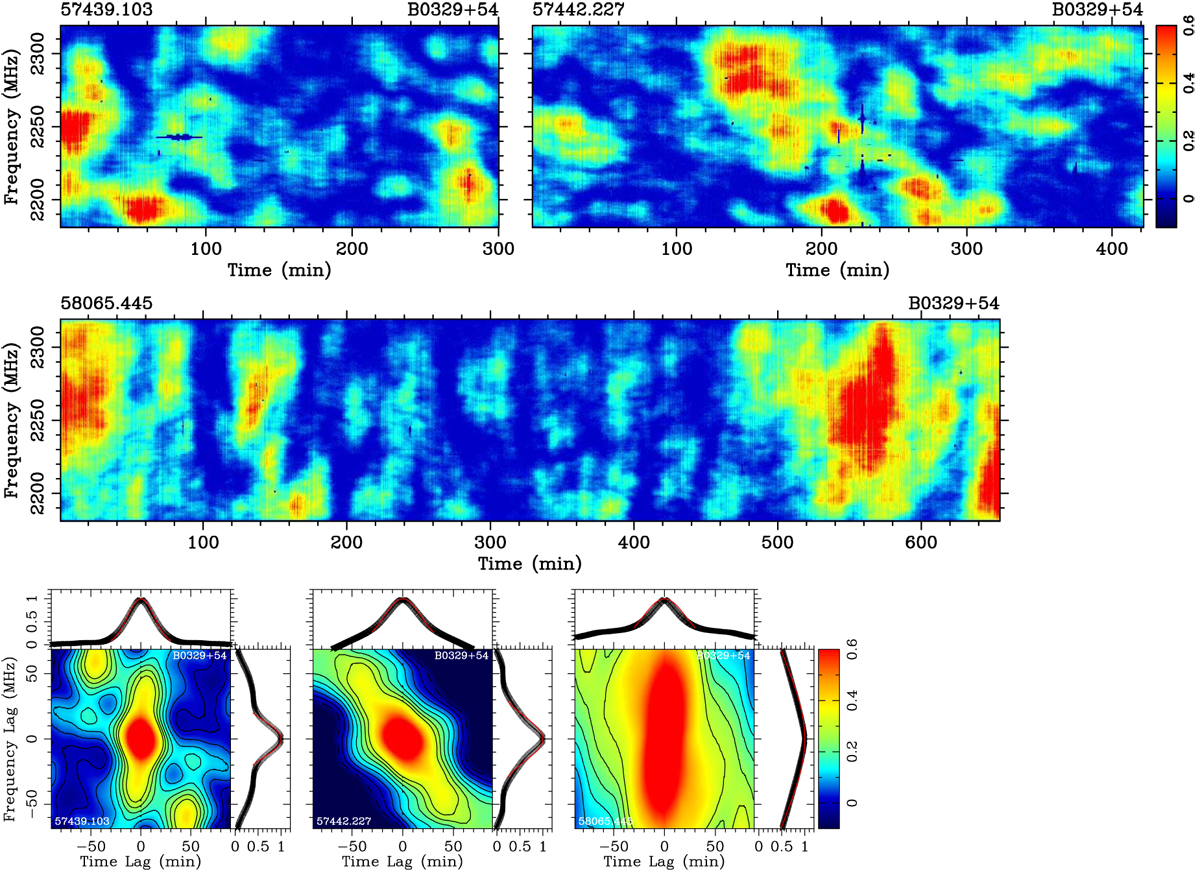
Dynamic spectra S1(t, ν) from three observations of PSR B0329+54 (upper three panels) and their autocorrelation functions A(Δ t, Δν) (panels in the lowest row). Some dummy points caused by the interference are set as S1 (t, ν)= 0. Observationtime (in MJD) and pulsar name are indicated above each plot. The autocorrelation functions are plotted against time lag Δt in minutes and frequency lag Δν in MHz. The two-dimensional Gaussian functions are fitted to the main peaks of the autocorrelation functions to derive the scintillation parameters. In the side-panels only data for the cross-sections are shown by “x” (too many for this pulsar mean that they look as if they were a thick line, butnot so many for the other pulsars shown in other figures) and the fitted lines at Δ t = 0 and Δ ν= 0 are drawn. The color schemes are indicated by the wedges for both the dynamic spectra and autocorrelation functions, which are saturated at − 10% and 60% of the peak values (with exceptions for other pulsars, but these are especially marked).
Current usage metrics show cumulative count of Article Views (full-text article views including HTML views, PDF and ePub downloads, according to the available data) and Abstracts Views on Vision4Press platform.
Data correspond to usage on the plateform after 2015. The current usage metrics is available 48-96 hours after online publication and is updated daily on week days.
Initial download of the metrics may take a while.