Free Access
Fig. 3.
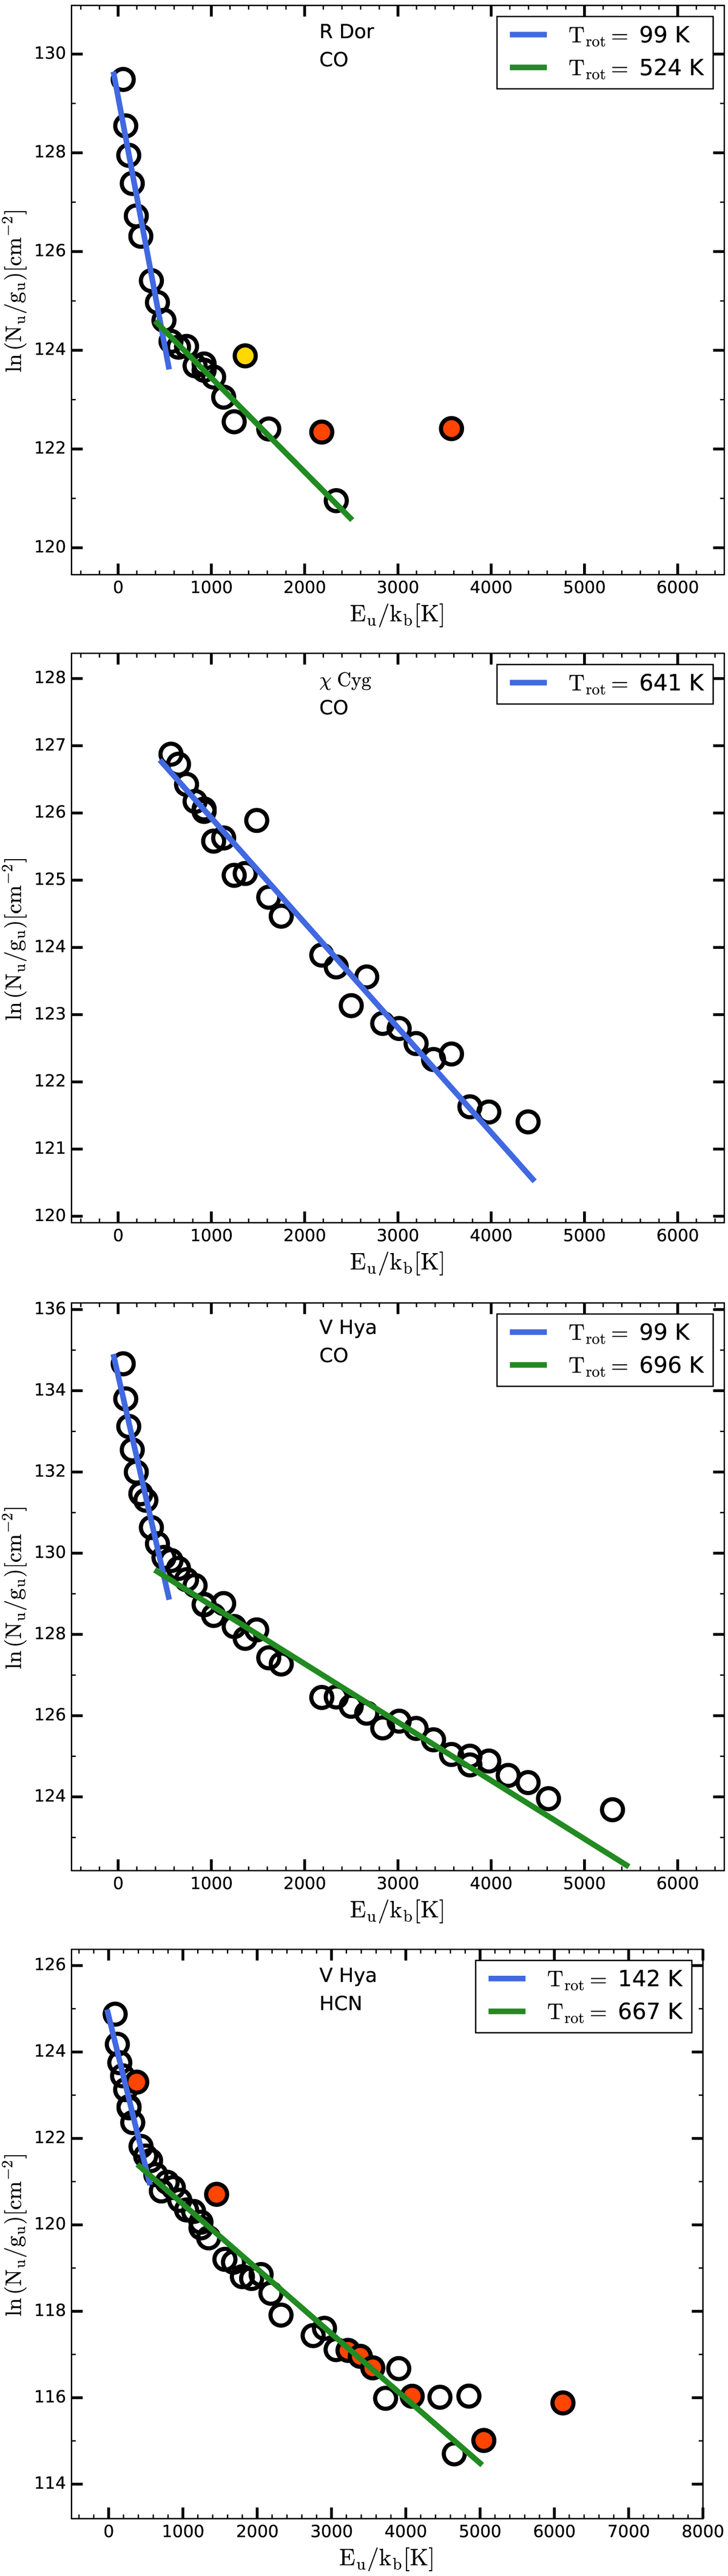
Examples for rotational diagrams for CO in R Dor and χ Cyg, and CO and HCN in V Hya. The other diagrams are given in Appendix C. Yellow and red symbols are points excluded from the fit (see text for details).
Current usage metrics show cumulative count of Article Views (full-text article views including HTML views, PDF and ePub downloads, according to the available data) and Abstracts Views on Vision4Press platform.
Data correspond to usage on the plateform after 2015. The current usage metrics is available 48-96 hours after online publication and is updated daily on week days.
Initial download of the metrics may take a while.