Free Access
Fig. 2.
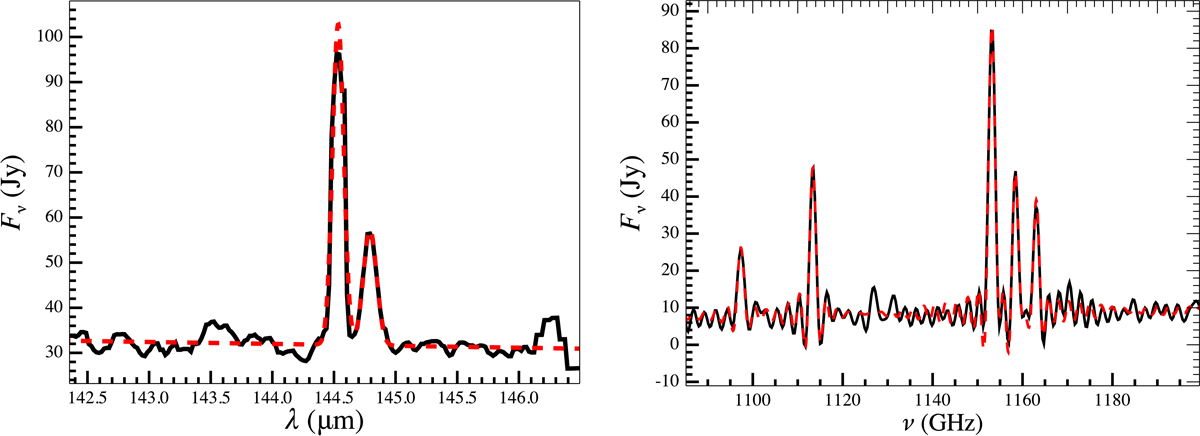
Example of line fitting (red dotted line) for the PACS and SPIRE spectrum (black full line) of the M-type AGB-star R Dor. The fitting functions are Gaussians for PACS (left panel) and sync functions for SPIRE (right panel). The local maxima at 143.5 and 146.2 μm and 1130 GHz have not been selected as lines by the algorithm.
Current usage metrics show cumulative count of Article Views (full-text article views including HTML views, PDF and ePub downloads, according to the available data) and Abstracts Views on Vision4Press platform.
Data correspond to usage on the plateform after 2015. The current usage metrics is available 48-96 hours after online publication and is updated daily on week days.
Initial download of the metrics may take a while.