Fig. B.1.
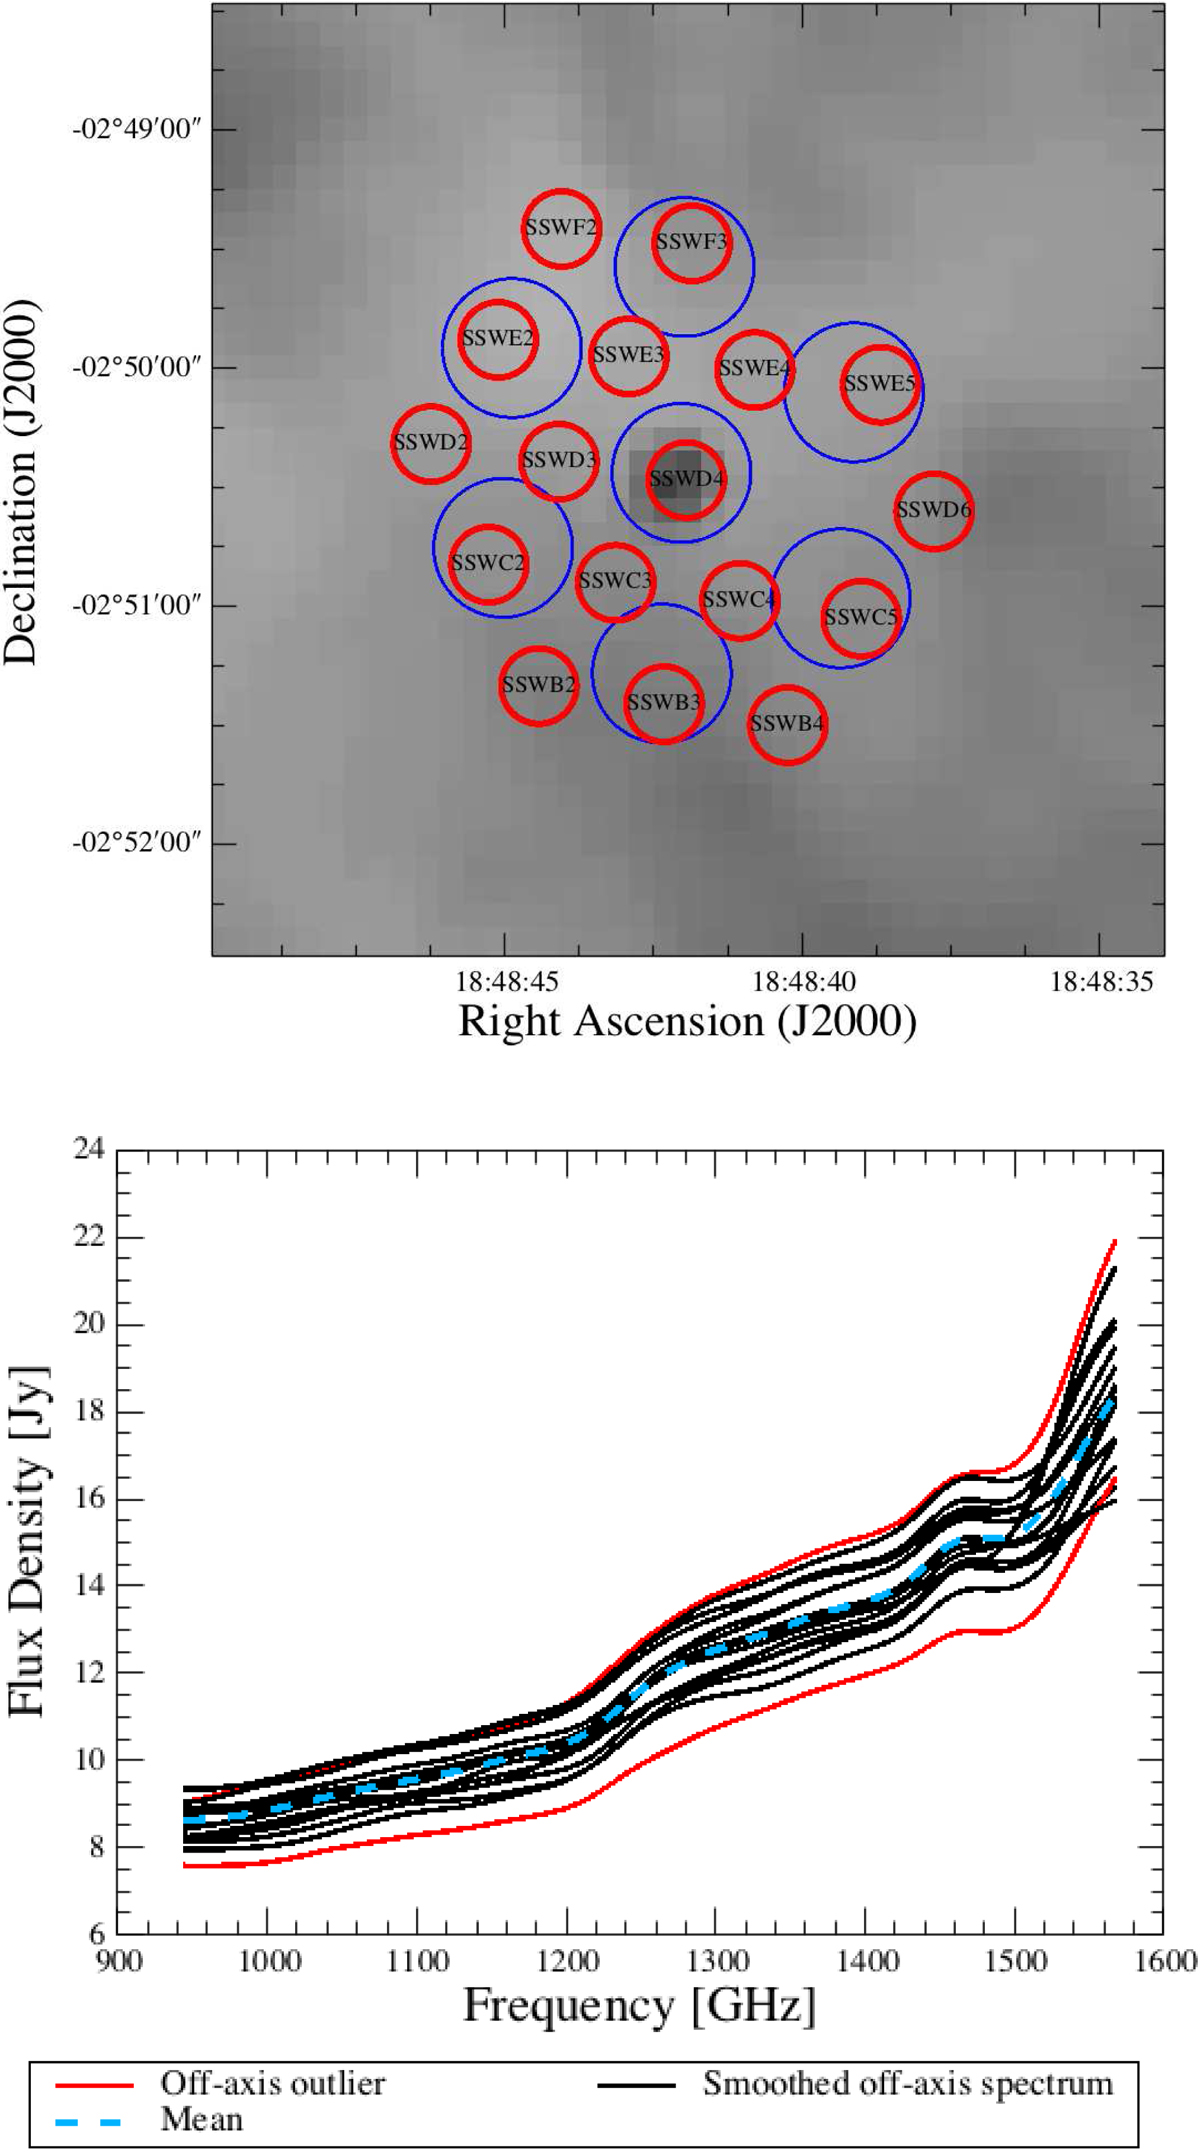
Top panel: footprint of the SPIRE spectrometer detectors on the sky for OH 30.1 −0.7. The blue and red circles represent the beams of the SLW and SSW arrays, respectively (the SSW arrays are identified individually). Two SSW detectors are not considered for background subtraction, and are not represented, which explains the apparent asymmetry of the SSW detector array. Lower panel: smoothed off-axis detector intensities and mean off-axis intensities for the SSW array. The black and red curves represent the smoothed spectra measured in the off-axis detectors, i.e. off-source. The spectra marked in red at the edge of the distribution are not used for background subtraction. The others (in black) are averaged, and the average (dotted blue curve) is used for background subtraction.
Current usage metrics show cumulative count of Article Views (full-text article views including HTML views, PDF and ePub downloads, according to the available data) and Abstracts Views on Vision4Press platform.
Data correspond to usage on the plateform after 2015. The current usage metrics is available 48-96 hours after online publication and is updated daily on week days.
Initial download of the metrics may take a while.