Fig. 4.
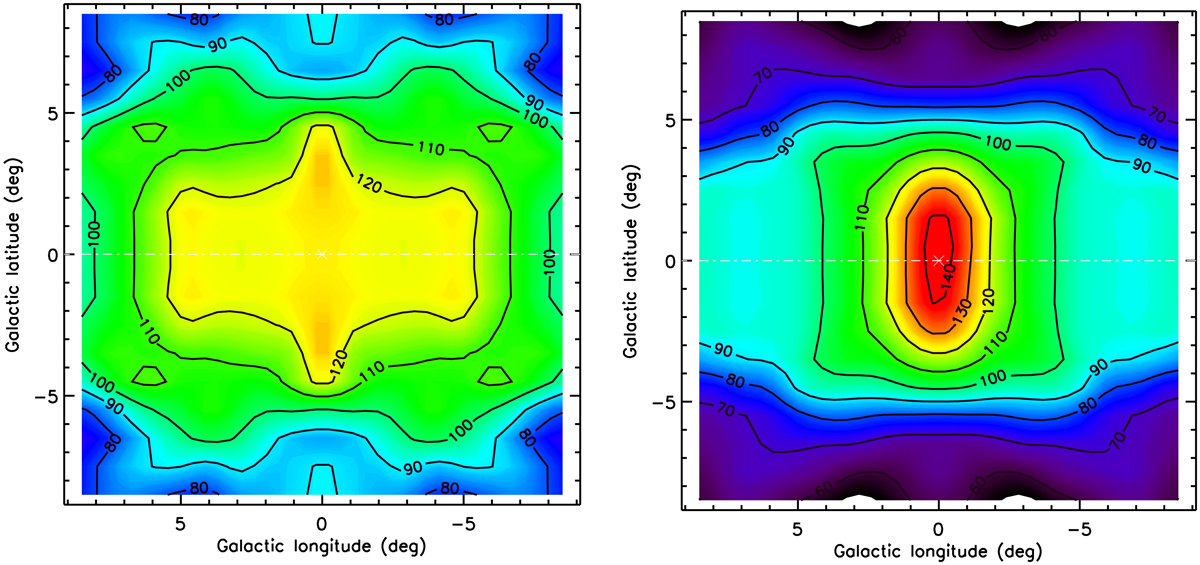
Spatial trends of the galactocentric radial velocity dispersion for the MP (left) and MR (right) component, respectively. The maps are the results of a linear interpolation between the measured value of the σ for the two components in the 26 GIBS fields. The maps are symmetric in longitude and latitude by construction, and have been normalized to the same color scale. Contours show the value of σ, in km s−1, in step of 10.
Current usage metrics show cumulative count of Article Views (full-text article views including HTML views, PDF and ePub downloads, according to the available data) and Abstracts Views on Vision4Press platform.
Data correspond to usage on the plateform after 2015. The current usage metrics is available 48-96 hours after online publication and is updated daily on week days.
Initial download of the metrics may take a while.