Fig. 3.
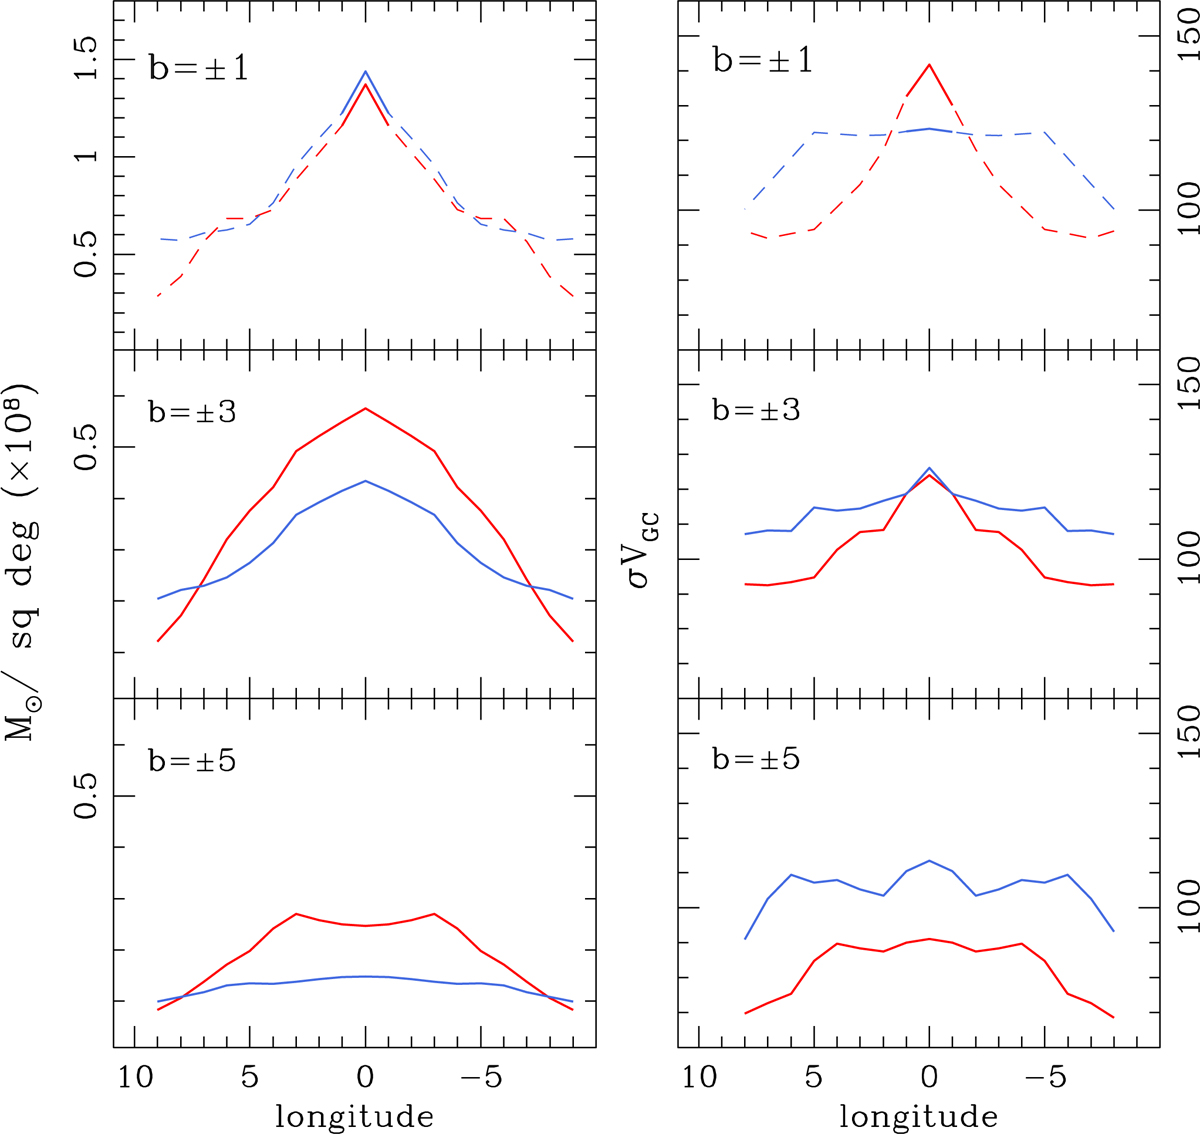
Left panels: stellar mass profile as a function of longitude for three different latitudes for MP (blue) and MR (red) stars, respectively. Right panels: same thing for the galactocentric radial velocity profile. At b = ±1 the curves are dashed, except at l = 0, to point out that they are constrained by a single field at (l, b) ∼ (0, −1), and, only through the interpolation, by the fields at (b = −2).
Current usage metrics show cumulative count of Article Views (full-text article views including HTML views, PDF and ePub downloads, according to the available data) and Abstracts Views on Vision4Press platform.
Data correspond to usage on the plateform after 2015. The current usage metrics is available 48-96 hours after online publication and is updated daily on week days.
Initial download of the metrics may take a while.