Fig. 1.
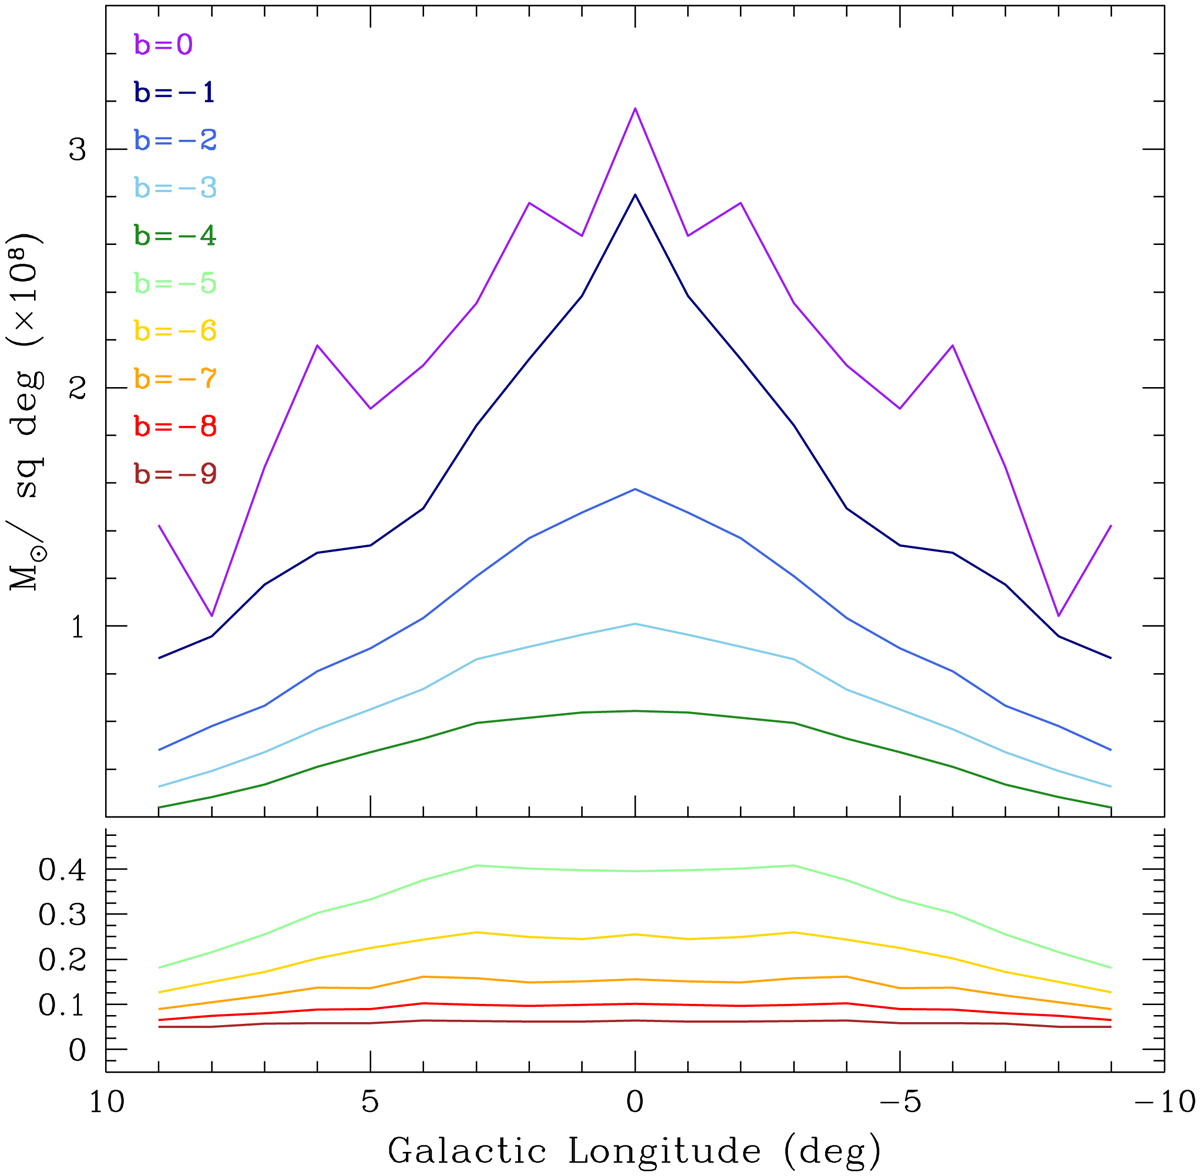
Stellar mass profile of the Galactic bulge, as a function of longitude, for different latitudes. The curves at low latitudes are shown on a different vertical scale, to increase visibility. This is a new version of Fig. 5 in Valenti et al. (2016) where we have imposed symmetry about the Galactic plane and about the bulge projected minor axis (l = 0). Statistical uncertainties, coming from the Poisson fluctuation on the number of RC stars are ∼ 1%. Errorbars of 15% of the data points are shown to account for the systematics, such as the IMF slope, the disk contamination and the adopted size of the RC box; see Valenti et al. (2016) for a discussion.
Current usage metrics show cumulative count of Article Views (full-text article views including HTML views, PDF and ePub downloads, according to the available data) and Abstracts Views on Vision4Press platform.
Data correspond to usage on the plateform after 2015. The current usage metrics is available 48-96 hours after online publication and is updated daily on week days.
Initial download of the metrics may take a while.