Free Access
Fig. 2.
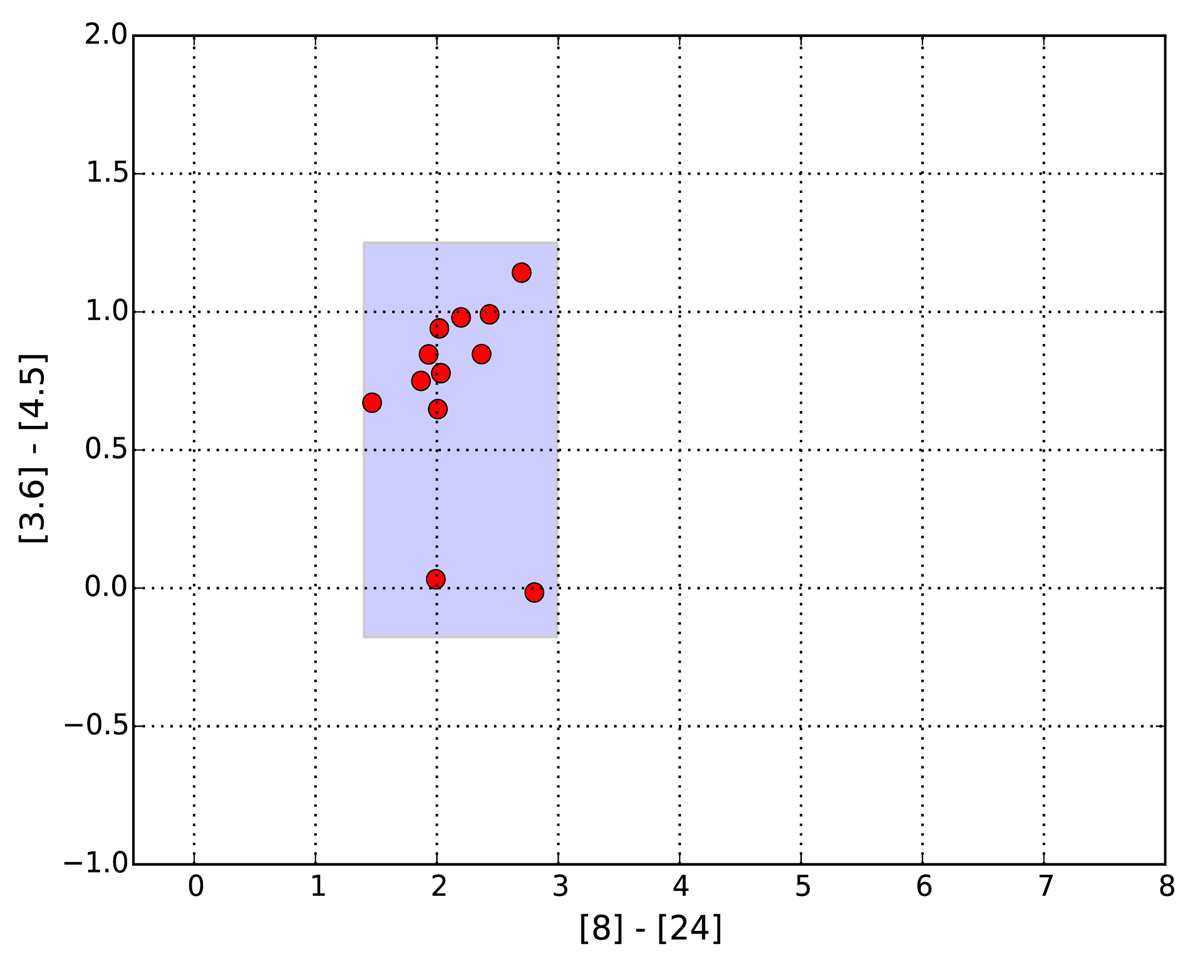
Spitzer colour-colour plot of the sample RV Tauri stars in the LMC. The red markers show the 12 sample stars for which IRAC and MIPS fluxes were available. The stars lie in the blue shaded region, which is defined as the region occupied by disc-type objects (Kamath et al. 2015).
Current usage metrics show cumulative count of Article Views (full-text article views including HTML views, PDF and ePub downloads, according to the available data) and Abstracts Views on Vision4Press platform.
Data correspond to usage on the plateform after 2015. The current usage metrics is available 48-96 hours after online publication and is updated daily on week days.
Initial download of the metrics may take a while.