Fig. 15.
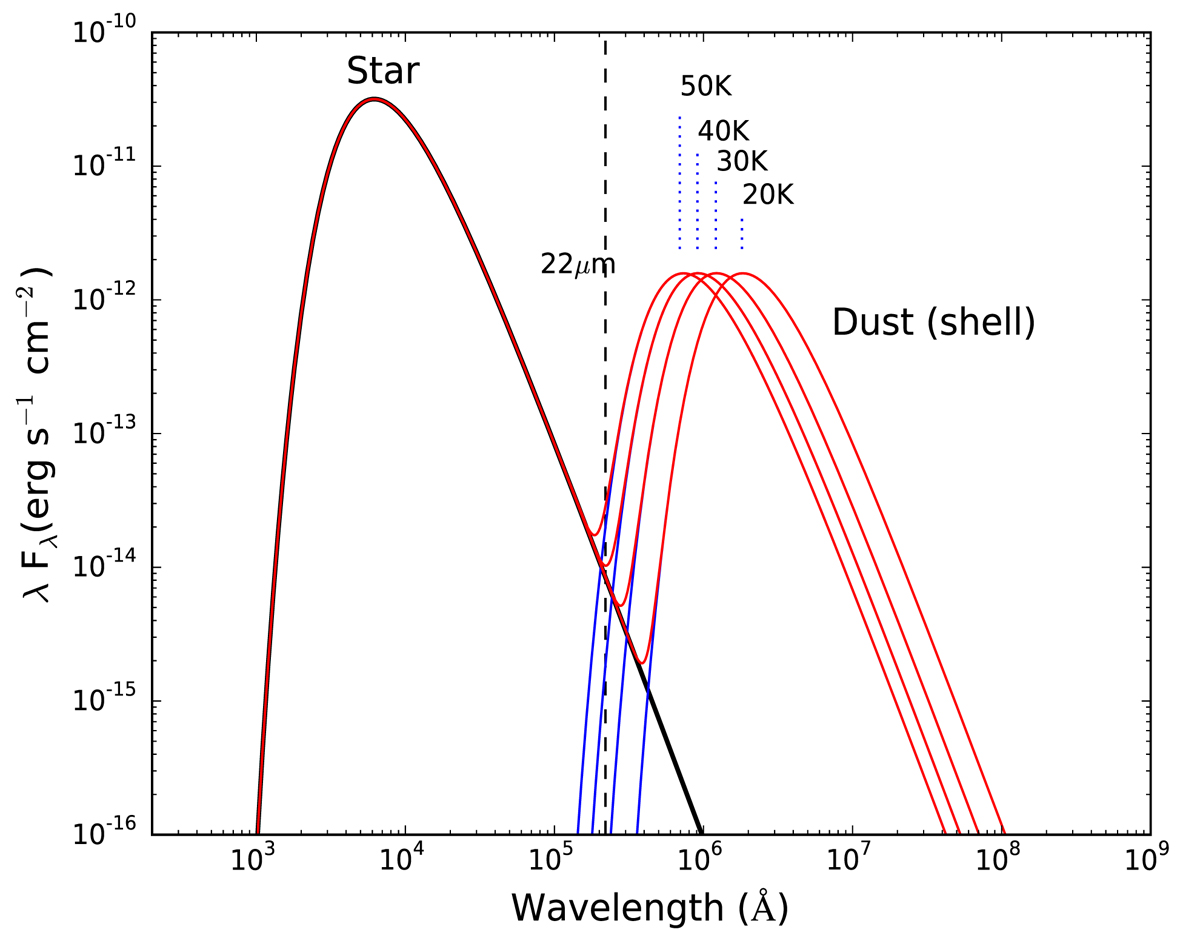
Star with luminosity, L ∼ 3300 L⊙ represented by a black body with Teff ∼ 5900K. The dust shells, assuming they absorb and emit as black bodies represented by the blue curves with T = 50 K, 40 K, 30 K, and 20 K. The red curves represent, in each case, the sum of the blackbody spectra of the star and shell. The dashed vertical line is indicated at 22 µm.
Current usage metrics show cumulative count of Article Views (full-text article views including HTML views, PDF and ePub downloads, according to the available data) and Abstracts Views on Vision4Press platform.
Data correspond to usage on the plateform after 2015. The current usage metrics is available 48-96 hours after online publication and is updated daily on week days.
Initial download of the metrics may take a while.