Fig. 12.
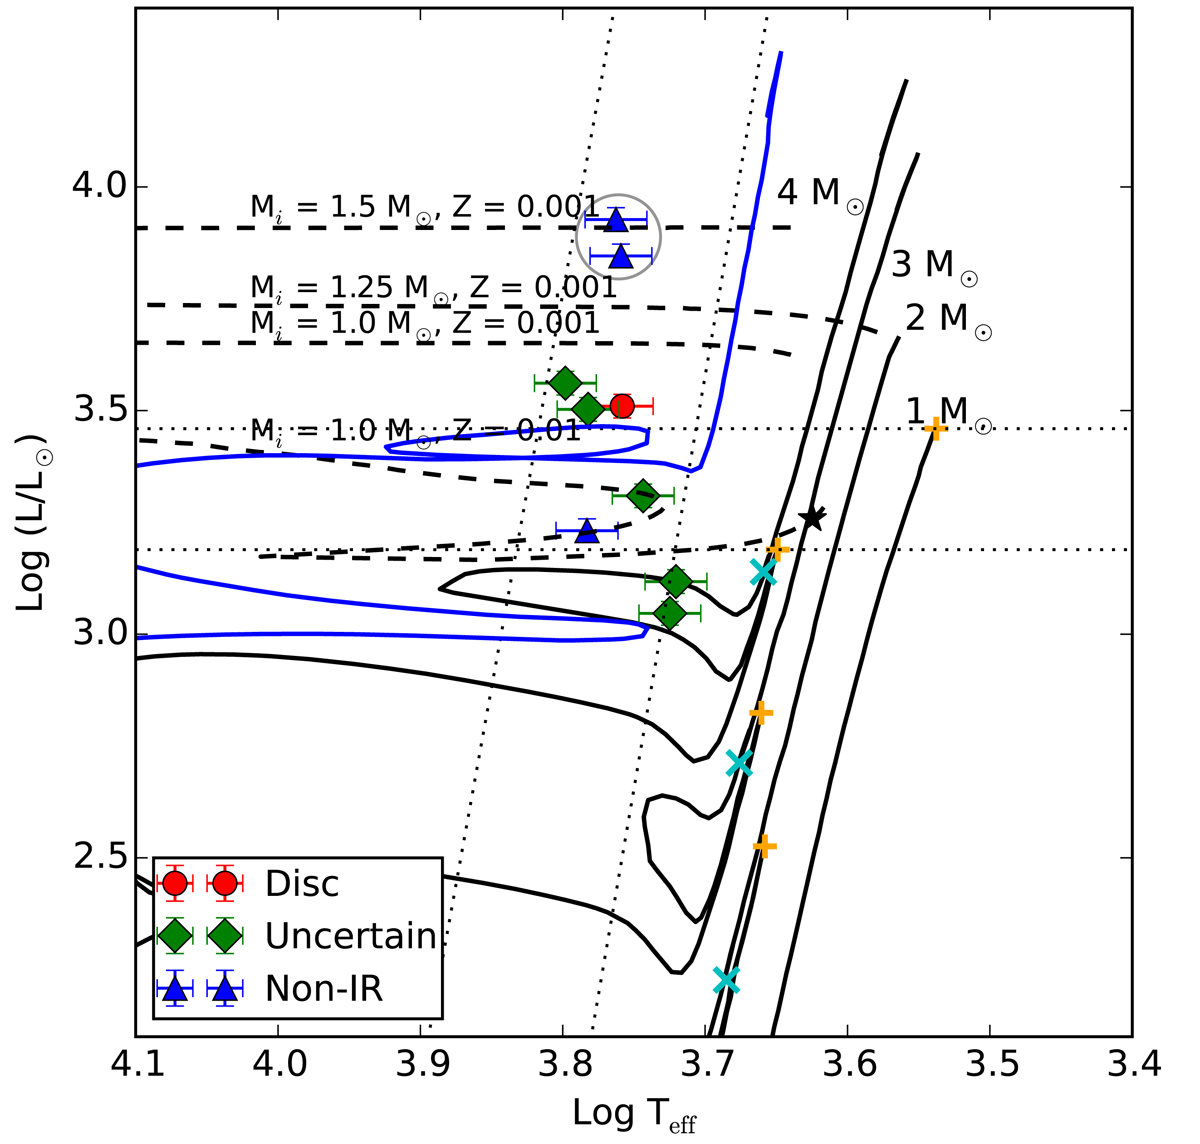
SMC RV Tauri stars with different SED characteristic, plotted in the HRD. The black lines are evolutionary tracks for a 1 M⊙, 2 M⊙, 3 M⊙, and 4 M⊙ stars with a composition of Z = 0.004 and Y = 0.26 for the SMC (Bertelli et al. 2009). The dashed lines are post-AGB tracks from Miller Bertolami (2016) for 1 M⊙ and 1.5 M⊙ stars and Z = 0.001, plotted as 2nd and 3rd from bottom, respectively. The bottom-most dashed track is for a 1 M⊙ star with a metallicity of Z = 0.01, which is at a lower luminosity than a post-AGB track of Z = 0.001. The blue line represents the evolution of a 3 M⊙ star, which goes through a blue-loop phase. The slanted dotted lines show the theoretical instability strip taken from Kiss et al. (2007). The tip of the RGB for each track corresponding to a mean metallicity of the SMC are indicated with orange “+” signs , which are at L ∼ 2880, 330, 660, and 1560 L⊙ for the 1, 2, 3, and 4 M⊙ tracks, respectively. The cyan “x” markers represent the start of the early AGB phase (E-AGB), which are at L ∼ 170, 510, and 1380 L⊙ for the 2, 3, and 4 M⊙ tracks, respectively. The stars in the grey circle are the OGLE-SMC-T2CEP-07 and OGLE-SMC-T2CEP-29, which shows ellipsoidal variability and eclipses in their light curves, respectively. The upper and lower horizontal dotted lines indicate the tip of the RGB for a 1 and 4 M⊙ star, respectively
Current usage metrics show cumulative count of Article Views (full-text article views including HTML views, PDF and ePub downloads, according to the available data) and Abstracts Views on Vision4Press platform.
Data correspond to usage on the plateform after 2015. The current usage metrics is available 48-96 hours after online publication and is updated daily on week days.
Initial download of the metrics may take a while.