Fig. 11.
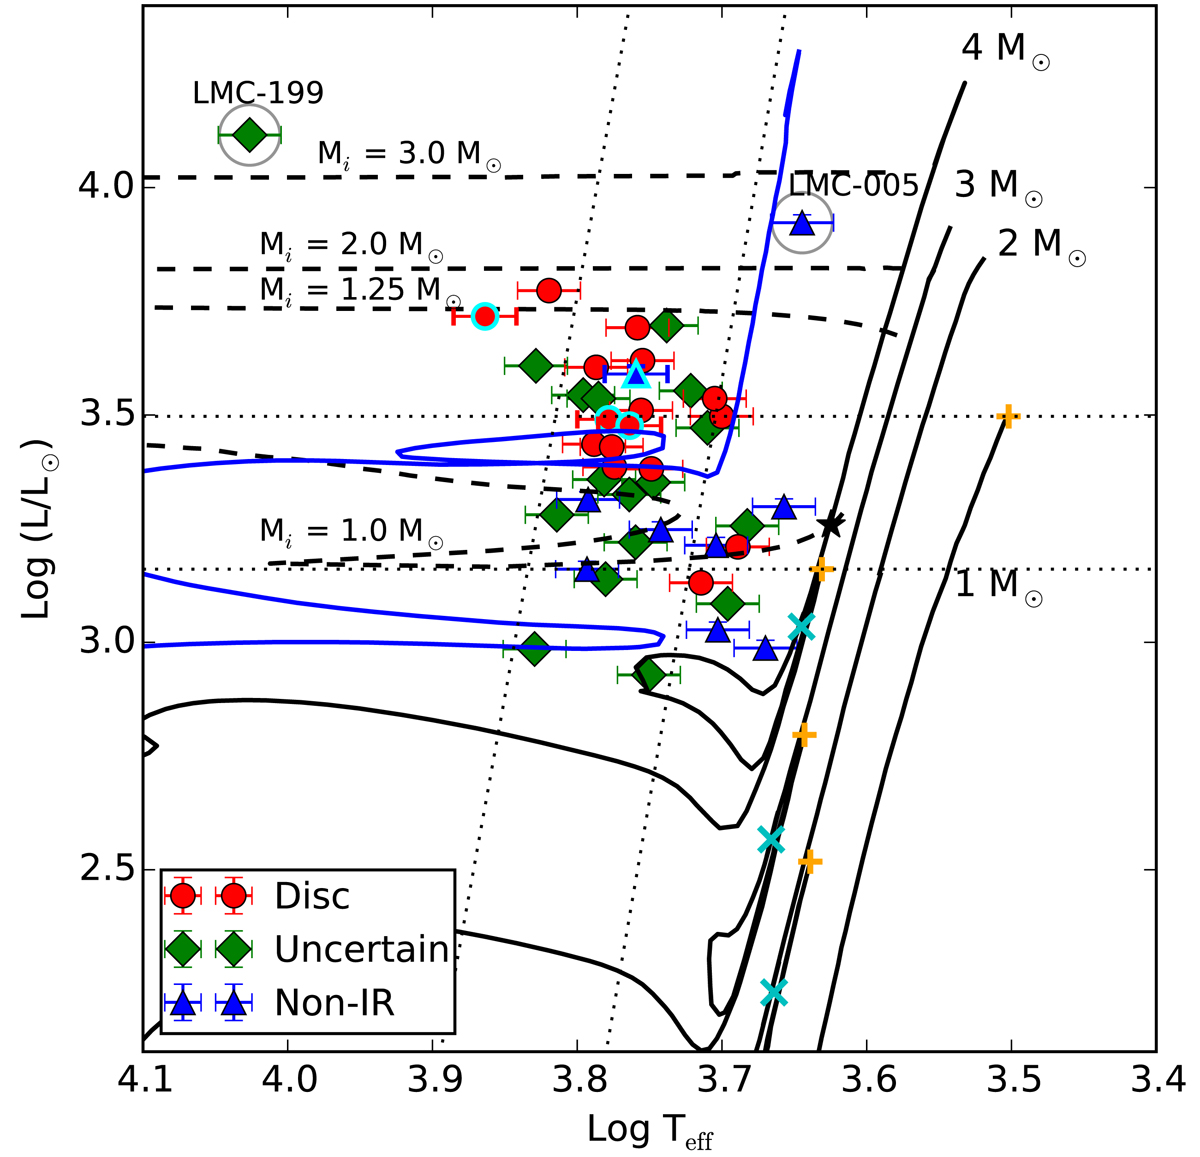
LMC RV Tauri stars with different SED characteristic, plotted in the HRD. The black lines are evolutionary tracks for a 1 M⊙, 2 M⊙, 3 M⊙, and 4 M⊙ stars with a composition of Z = 0.008 and Y = 0.26 for the LMC (Bertelli et al. 2009). The dashed lines are post-AGB tracks from Miller Bertolami (2016) for 1 M⊙, 1.25 M⊙, 2 M⊙, and 3 M⊙ initial mass stars with an initial metallicity of Z = 0.001. The blue line represents the evolution of a 3 M⊙ star, which goes through a blue-loop phase. The slanted dotted lines show the theoretical instability strip taken from Kiss et al. (2007). The four points with cyan marker edges indicate the position of OGLE-LMC-T2CEP-119, OGLE-LMC-T2CEP-149, OGLE-LMC-T2CEP-190, and OGLE-LMC-T2CEP-191, which display clear period change in their (O−C) diagram. The stars in the grey circles denote the position of OGLE-LMC-T2CEP-005 and OGLE-LMC-T2CEP-199, which have higher-than-expected luminosities (see Sect. 7.5). The tip of the RGB for each track corresponding to a mean metallicity of the LMC are indicated with orange “+” signs, which are at L ∼ 3150, 330, 630, and 1450 L⊙ for the 1, 2, 3, and 4 M⊙ tracks, respectively. The upper and lower horizontal dotted lines indicate the tip of the RGB for a 1 and 4 M⊙ star, respectively. The cyan “x” markers represent the start of the early AGB phase (E-AGB); these markers are at L ∼ 170, 370 and 1090 L⊙ for the 2, 3 and 4 M⊙ tracks, respectively.
Current usage metrics show cumulative count of Article Views (full-text article views including HTML views, PDF and ePub downloads, according to the available data) and Abstracts Views on Vision4Press platform.
Data correspond to usage on the plateform after 2015. The current usage metrics is available 48-96 hours after online publication and is updated daily on week days.
Initial download of the metrics may take a while.