Fig. 5.
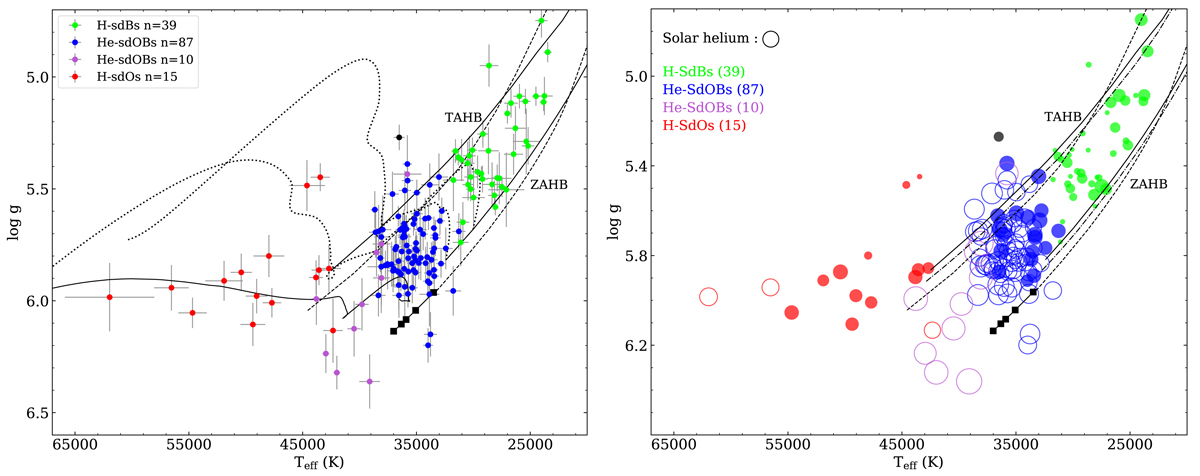
Left panel: position of the stars in the log g − Teff diagram. The spectroscopic groups are plotted as in Fig. 4. The error bars used for individual stars are the statistical uncertainties returned by the fitting procedure. The ZAHB and TAHB sequences are plotted for two different helium contents Y = 0.24 (solid lines) and Y = 0.40 (dashed lines) and a metallicity of [M/H] = −1.8. Canonical evolutionary tracks with Y = 0.24 are shown for models having 0.498 and 0.5 M⊙ (dotted curves). The connected squares represent a series of ZAHB models computed by adding a hydrogen-rich layer to the surface of a late-flasher ZAHB model. The squares indicate hydrogen layer masses (with decreasing temperature) of 0, 10−7, 10−6, 10−5, and 10−4 M⊙ (Moehler et al. 2002). An additional late-flasher evolutionary track is plotted (solid curve), corresponding to the Z = 0.001 and M = 0.491 M⊙ shallow-mixing case of Miller Bertolami et al. (2008). Right panel: similar to the left panel, but here the size of the circles is proportional to the logarithmic helium abundance, super-solar and sub-solar abundances being represented by open and filled circles respectively. The circle size for the solar helium abundance is shown for reference. The ZAHBs and TAHBs are plotted as in the left panel, with an additional sequence at a metallicity of [M/H] = −0.96 and Y = 0.24 added (dash-dotted lines).
Current usage metrics show cumulative count of Article Views (full-text article views including HTML views, PDF and ePub downloads, according to the available data) and Abstracts Views on Vision4Press platform.
Data correspond to usage on the plateform after 2015. The current usage metrics is available 48-96 hours after online publication and is updated daily on week days.
Initial download of the metrics may take a while.