Fig. B.1.
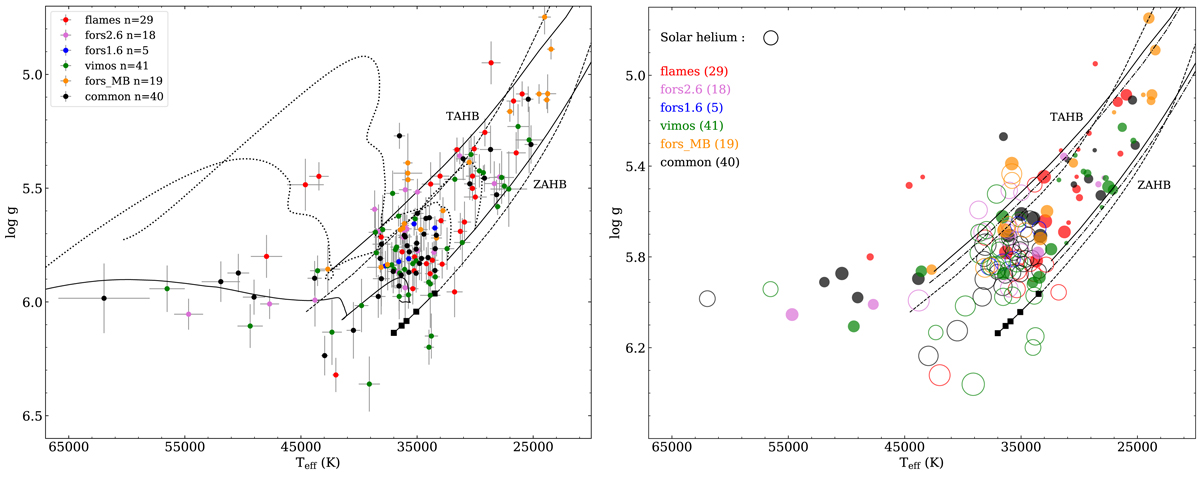
Left panel: position of the 152 stars in the log g − Teff diagram. The samples are indicated by different colors and the common group includes the stars present in two or three samples. The error bars used for individual stars are the statistical uncertainties returned by the fitting procedure. The ZAEHB, TAEHB and the evolutionary tracks are as in Fig. 5. Right panel: same as the left panel but with the logarithmic helium abundance illustrated by the size of each circles, where super-solar and sub-solar abundances are represented by open and filled circles respectively. The circle size for a solar abundance is shown as an indication.
Current usage metrics show cumulative count of Article Views (full-text article views including HTML views, PDF and ePub downloads, according to the available data) and Abstracts Views on Vision4Press platform.
Data correspond to usage on the plateform after 2015. The current usage metrics is available 48-96 hours after online publication and is updated daily on week days.
Initial download of the metrics may take a while.