Fig. 5.
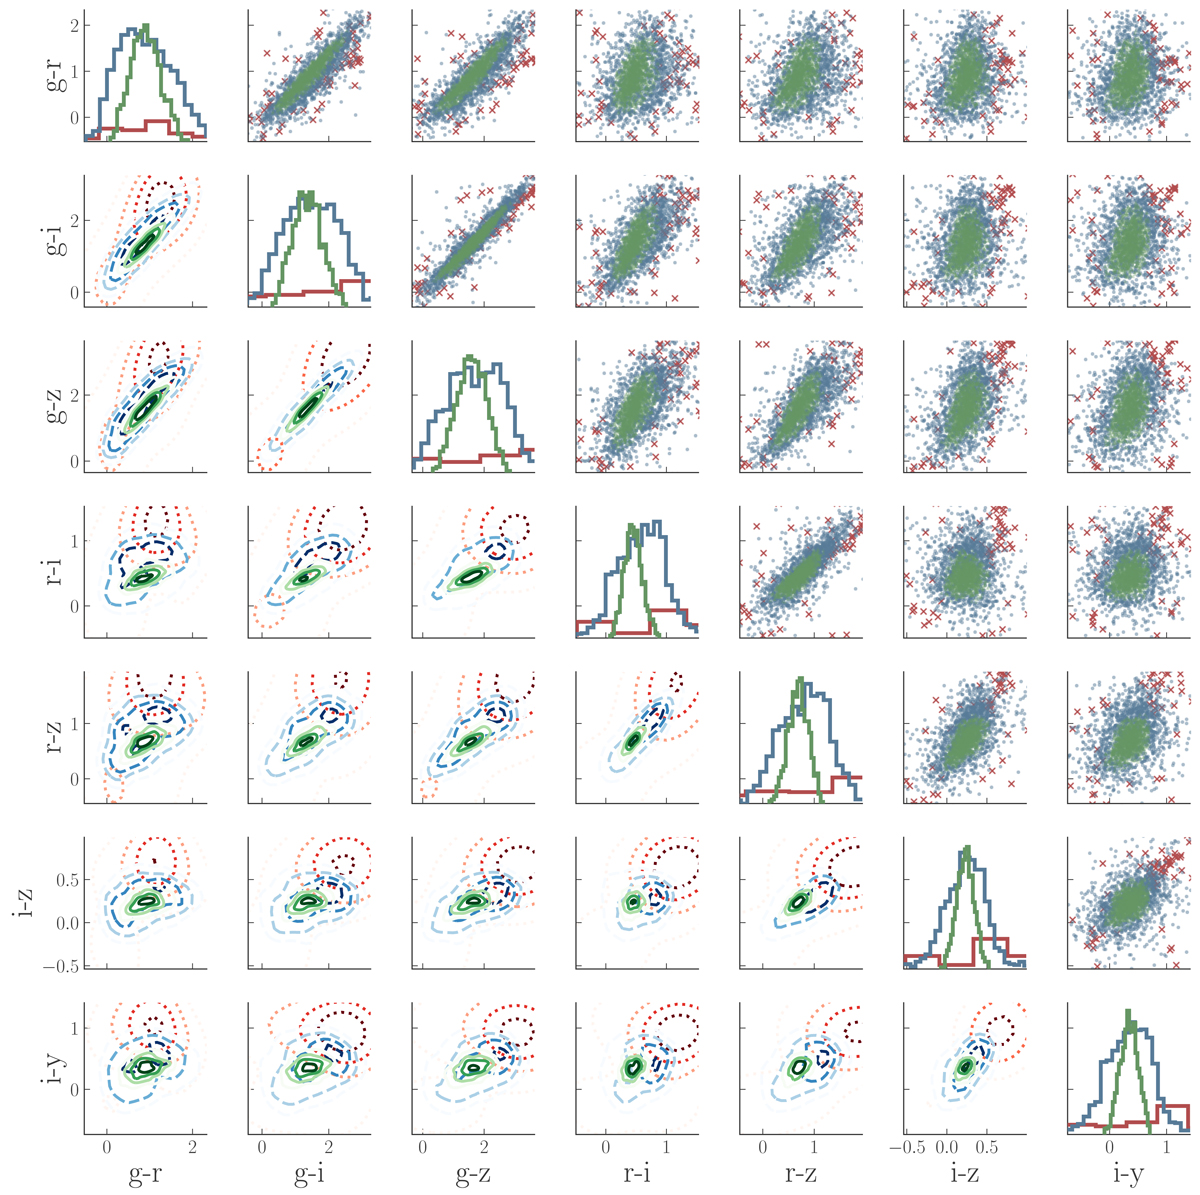
Diagonal: optical colour distributions for extended sources with only optical counterparts in the XPS catalogue. Above diagonal: colour-colour plots. Below diagonal: kernel density estimations of the colour distribution. Green (triangles in the colour-colour plots, solid lines in the density contour plots): sources with all colours within the well covered region of the training sample (inTSCS is true, see Appendix A); blue (circles in the colour-colour plots, dashed lines in the density contour plots): sources with at least one colour within the well covered region of the training sample; red (crosses in the colour-colour plots, dotted lines in the density contour plots): sources with all colours outside the well covered region of the training sample.
Current usage metrics show cumulative count of Article Views (full-text article views including HTML views, PDF and ePub downloads, according to the available data) and Abstracts Views on Vision4Press platform.
Data correspond to usage on the plateform after 2015. The current usage metrics is available 48-96 hours after online publication and is updated daily on week days.
Initial download of the metrics may take a while.