Fig. 2.
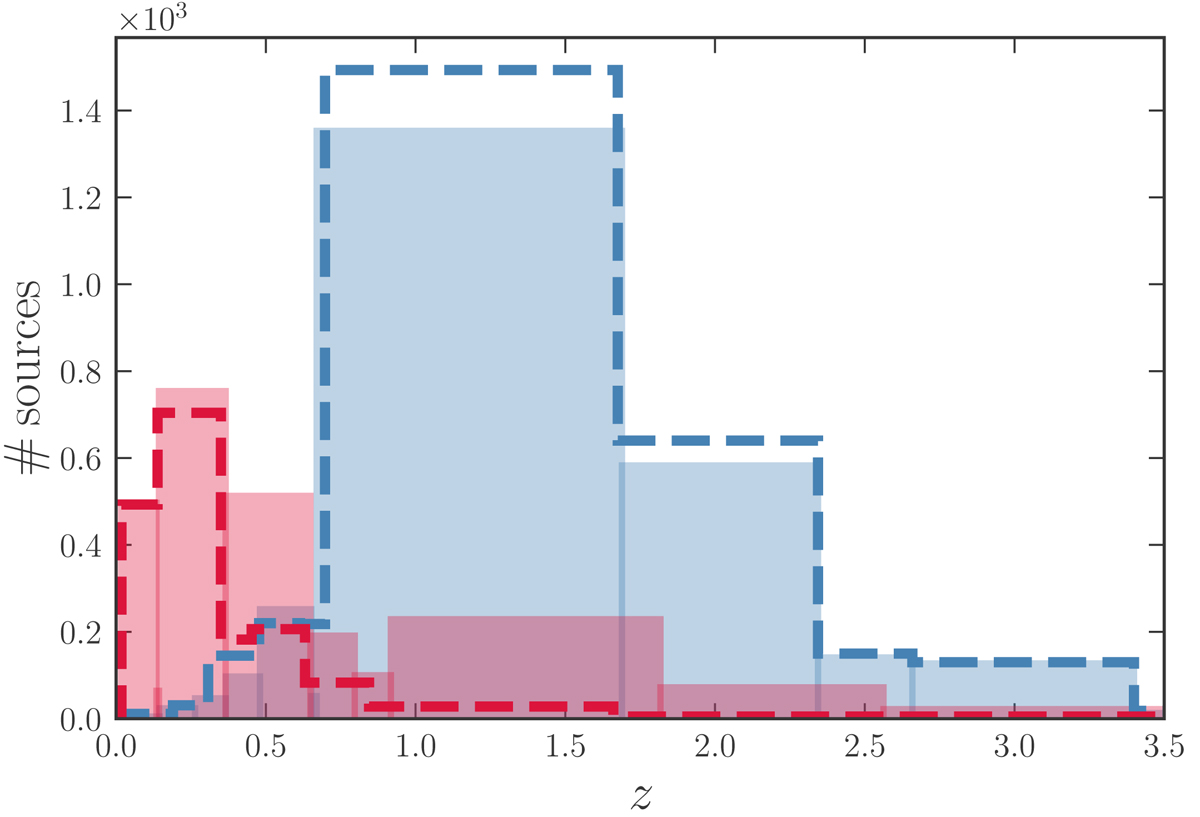
Redshift distribution of our training samples (five filters). Solid histograms correspond to the SDSS samples, and open, dashed histograms to the Pan-STARRS samples. Extended (point-like) sources are represented in red (blue). The histograms’ binning was estimated using the Bayesian block algorithm (BBA; Scargle et al. 2013).
Current usage metrics show cumulative count of Article Views (full-text article views including HTML views, PDF and ePub downloads, according to the available data) and Abstracts Views on Vision4Press platform.
Data correspond to usage on the plateform after 2015. The current usage metrics is available 48-96 hours after online publication and is updated daily on week days.
Initial download of the metrics may take a while.