Fig. 7.
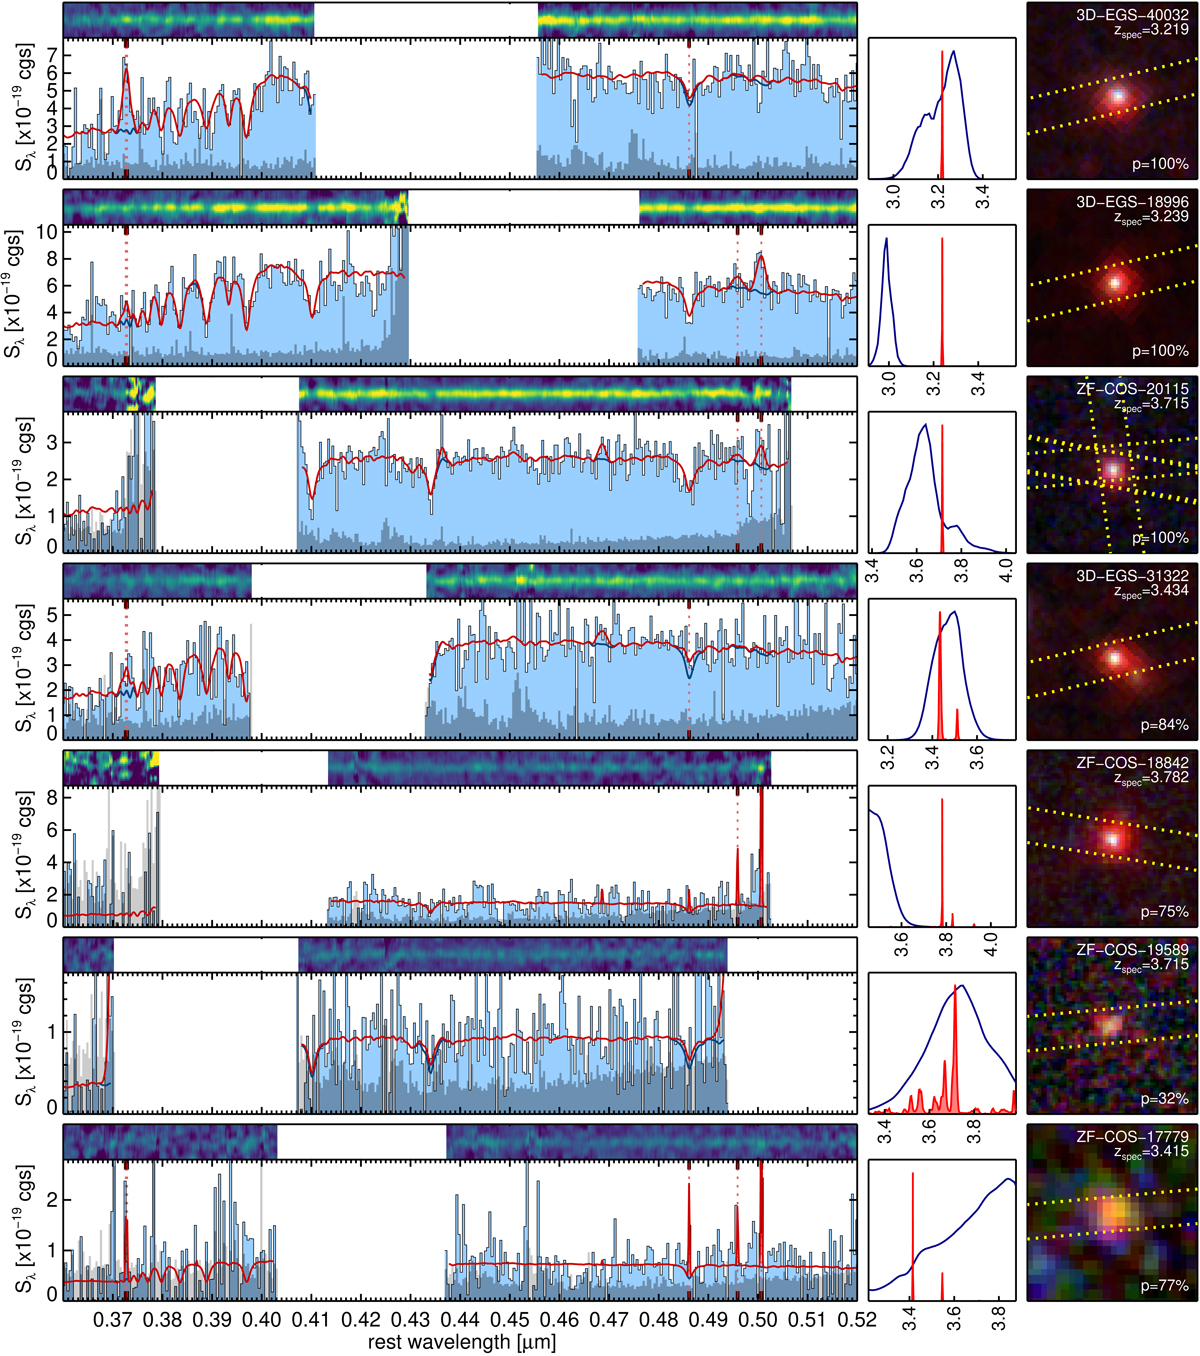
From left to right: MOSFIRE spectrum, redshift probability distribution, and false-color image of the galaxies with a measured zspec. The galaxies are sorted as in Fig. 6. The spectrum on the left is displayed as a function of rest-frame wavelength. The observed spectrum is shown with a black solid line and blue shading, and the best-fit model obtained at the end of the redshift fitting procedure is shown in red. The uncertainty is shown as a dark shaded area at the bottom of each plot, and the 2D spectrum is displayed at the top, with smoothing to enhance the display. For the redshift probability distribution, the p(z) from the spectra are shown in red, while the p(z) from the photometry (EAzY) are shown in dark blue. Finally, the false-color images are composed of the WFC3-F125W (blue), WFC3-F160W (green) and Ks bands (red, either from ZFOURGE, HawK-I, or Ultra-VISTA), with linear scaling. Each image is 3.6′′ × 3.6′′ across. We also show the extents of the MOSFIRE slits as a dotted yellow rectangles.
Current usage metrics show cumulative count of Article Views (full-text article views including HTML views, PDF and ePub downloads, according to the available data) and Abstracts Views on Vision4Press platform.
Data correspond to usage on the plateform after 2015. The current usage metrics is available 48-96 hours after online publication and is updated daily on week days.
Initial download of the metrics may take a while.