Fig. 6.
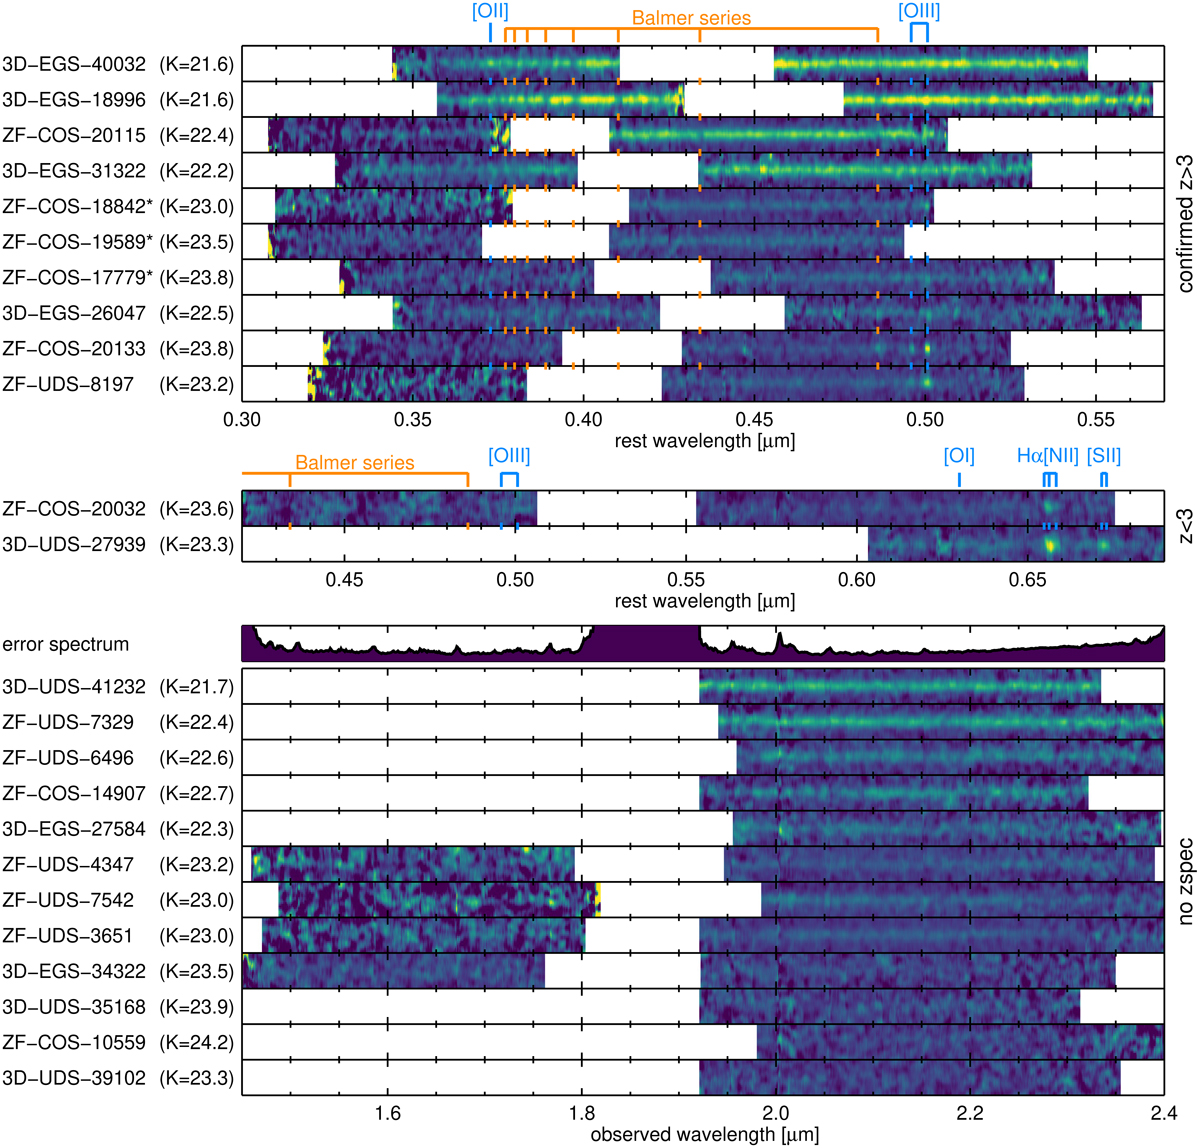
2D spectra of our sample, flux-calibrated and corrected for telluric absorption. For display purposes only, these spectra were smoothed with a 70 Å boxcar filter in wavelength and 0.7′′ FWHM Gaussian along the slit. The galaxies are sorted by decreasing K-band continuum S/N. Top: galaxies with a spectroscopic redshift zspec > 3, aligned on the same rest frame wavelength grid. The most prominent emission and absorption lines are labeled in blue and orange ticks, respectively. Galaxies with an uncertain redshift (see text) are marked with an asterisk. Middle: same as top but for zspec < 3. Bottom: galaxies without spectroscopic redshift, aligned on the same observed wavelength grid. The average error spectrum is shown at the top, to illustrate the regions with the strongest atmospheric features (telluric absorption and OH lines).
Current usage metrics show cumulative count of Article Views (full-text article views including HTML views, PDF and ePub downloads, according to the available data) and Abstracts Views on Vision4Press platform.
Data correspond to usage on the plateform after 2015. The current usage metrics is available 48-96 hours after online publication and is updated daily on week days.
Initial download of the metrics may take a while.