Fig. 5.
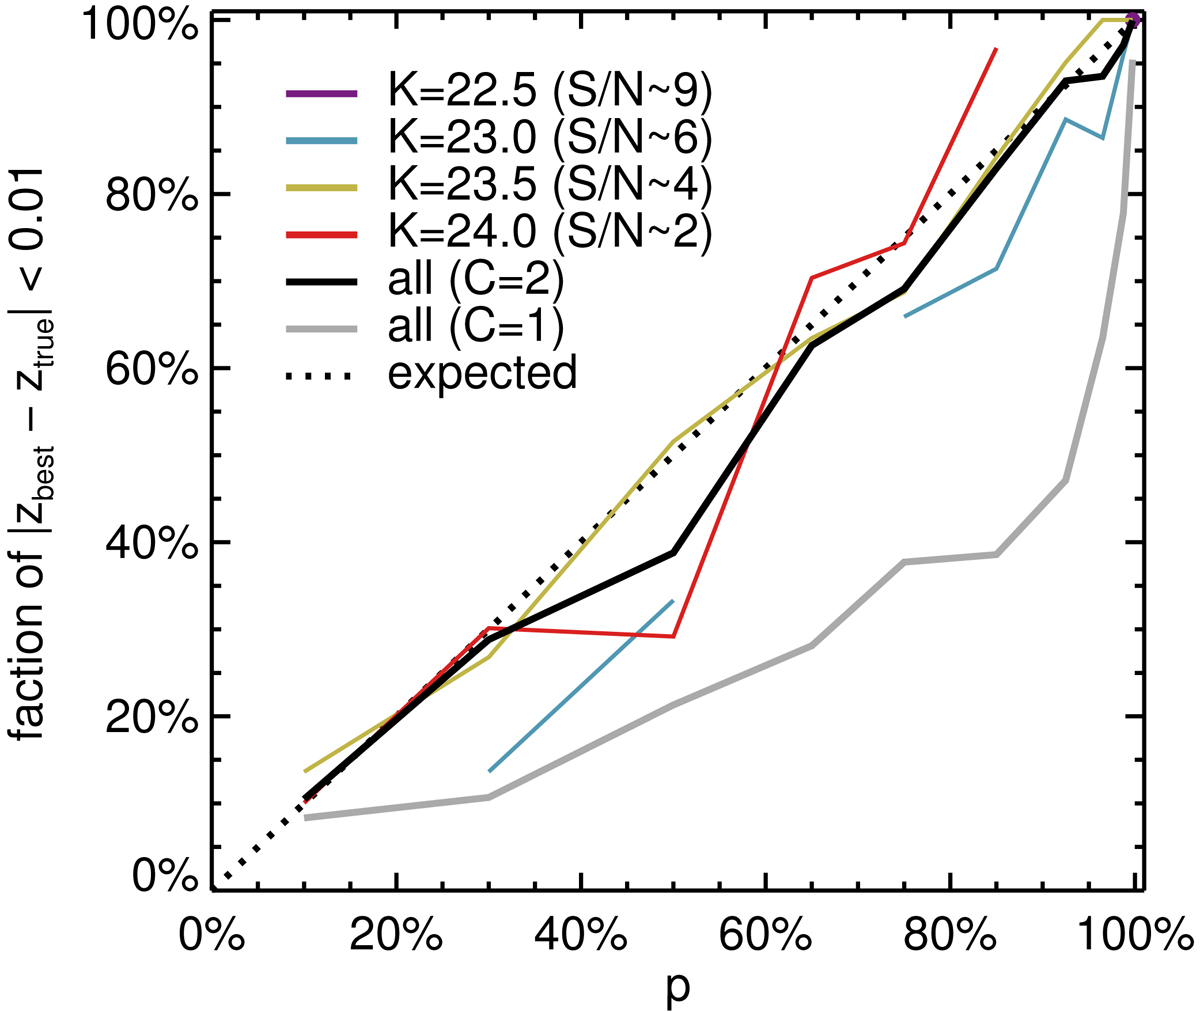
Calibration of the criterion for redshift reliability, p, using simulated spectra. The p value quantifies the probability that the measured redshift lies within Δz = 0.01 of the true redshift. The x-axis shows the p value estimated from the P(z) of the simulated spectra, and the y-axis is the actual fraction of the simulated redshift measurements that lie within Δz = 0.01 of the true redshift. The line of perfect agreement is shown wish a dashed black line. The relation obtained with C = 2 (see text) is shown with colored lines for simulated spectra of different K-band magnitude (the S/N given in parentheses corresponds to 70 Å bins), and for all magnitudes combined in black. All simulated galaxies with K = 22 had an estimated p ∼ 100% and are therefore shown as a single data point in the top-right corner. The relation for all magnitudes and C = 1 is shown in gray for comparison.
Current usage metrics show cumulative count of Article Views (full-text article views including HTML views, PDF and ePub downloads, according to the available data) and Abstracts Views on Vision4Press platform.
Data correspond to usage on the plateform after 2015. The current usage metrics is available 48-96 hours after online publication and is updated daily on week days.
Initial download of the metrics may take a while.