Fig. 3.
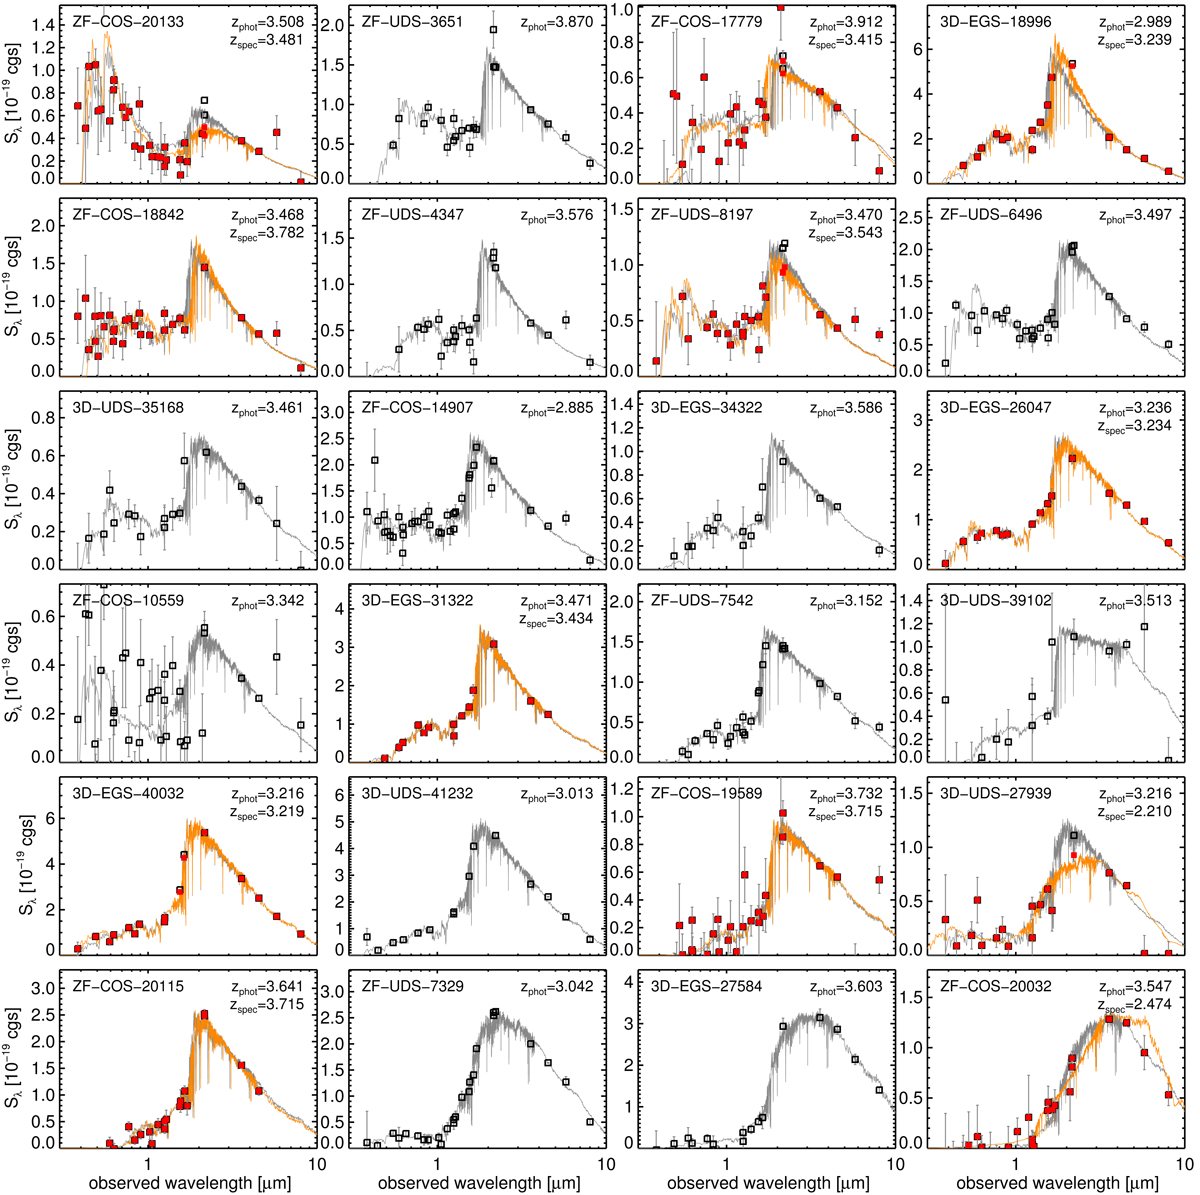
Spectral energy distributions of the galaxies in our target sample, sorted by increasing observer-frame z − K color (rest-frame NUV − g at z = 3.5). The observed photometry is shown with open black squares and gray error bars, and the best-fitting stellar continuum template from FAST++ obtained assuming z = zphot is shown in gray in the background. For galaxies with a measured spectroscopic redshift (see Sect. 3.3), we display the best-fitting template at z = zspec in orange, and the photometry corrected for emission line contamination with red squares.
Current usage metrics show cumulative count of Article Views (full-text article views including HTML views, PDF and ePub downloads, according to the available data) and Abstracts Views on Vision4Press platform.
Data correspond to usage on the plateform after 2015. The current usage metrics is available 48-96 hours after online publication and is updated daily on week days.
Initial download of the metrics may take a while.