Fig. 2.
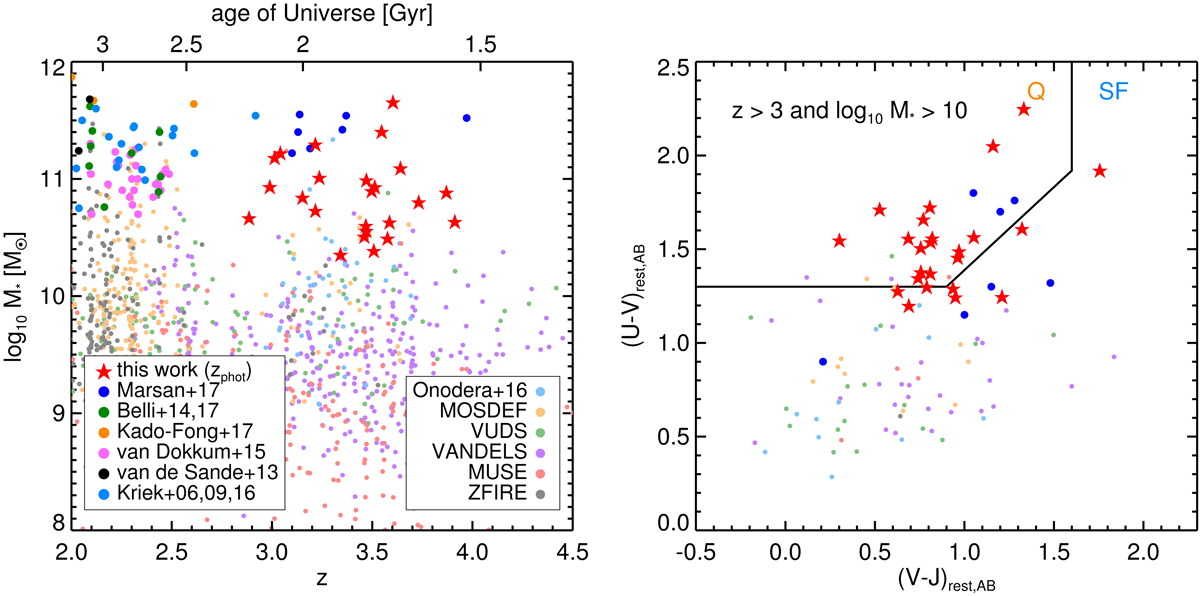
Left: stellar mass as a function of redshift for galaxies with public spectroscopic redshifts from the literature (circles) and galaxies from our sample with photometric redshifts (red stars, using photometric redshifts). We show the sample of massive z > 3 galaxies from Marsan et al. (2017) in dark blue, the sample of Onodera et al. (2016) in light blue, the quiescent z ∼ 2 galaxies of Belli et al. (20142017a) in dark green and Kado-Fong et al. (2017) in orange, the compact z ∼ 2 star-forming galaxies of van Dokkum et al. (2015) in pink, the quiescent galaxies observed in Kriek et al. (2006, 2009, 2016) in medium blue, the quiescent galaxies from van de Sande et al. (2013) in black, the galaxies observed by MOSDEF (Kriek et al. 2015) in orange, the galaxies observed by VUDS (Tasca et al. 2017) in green, the galaxies observed by VANDELS (McLure et al. 2017) in purple, the galaxies in the MUSE deep fields (Inami et al. 2017) in light pink, and the targets of the ZFIRE program in gray (Nanayakkara et al. 2016). Right: UVJ color-color diagram for a subset of galaxies shown on the left, limited to z > 3 and M* > 1010 M⊙. The (U − V) and (V − J) colors were computed in the rest frame, in the AB system. The black line delineates the standard dividing line between quiescent (Q) and star-forming (SF) galaxies, as defined in Williams et al. (2009).
Current usage metrics show cumulative count of Article Views (full-text article views including HTML views, PDF and ePub downloads, according to the available data) and Abstracts Views on Vision4Press platform.
Data correspond to usage on the plateform after 2015. The current usage metrics is available 48-96 hours after online publication and is updated daily on week days.
Initial download of the metrics may take a while.