Fig. B.1.
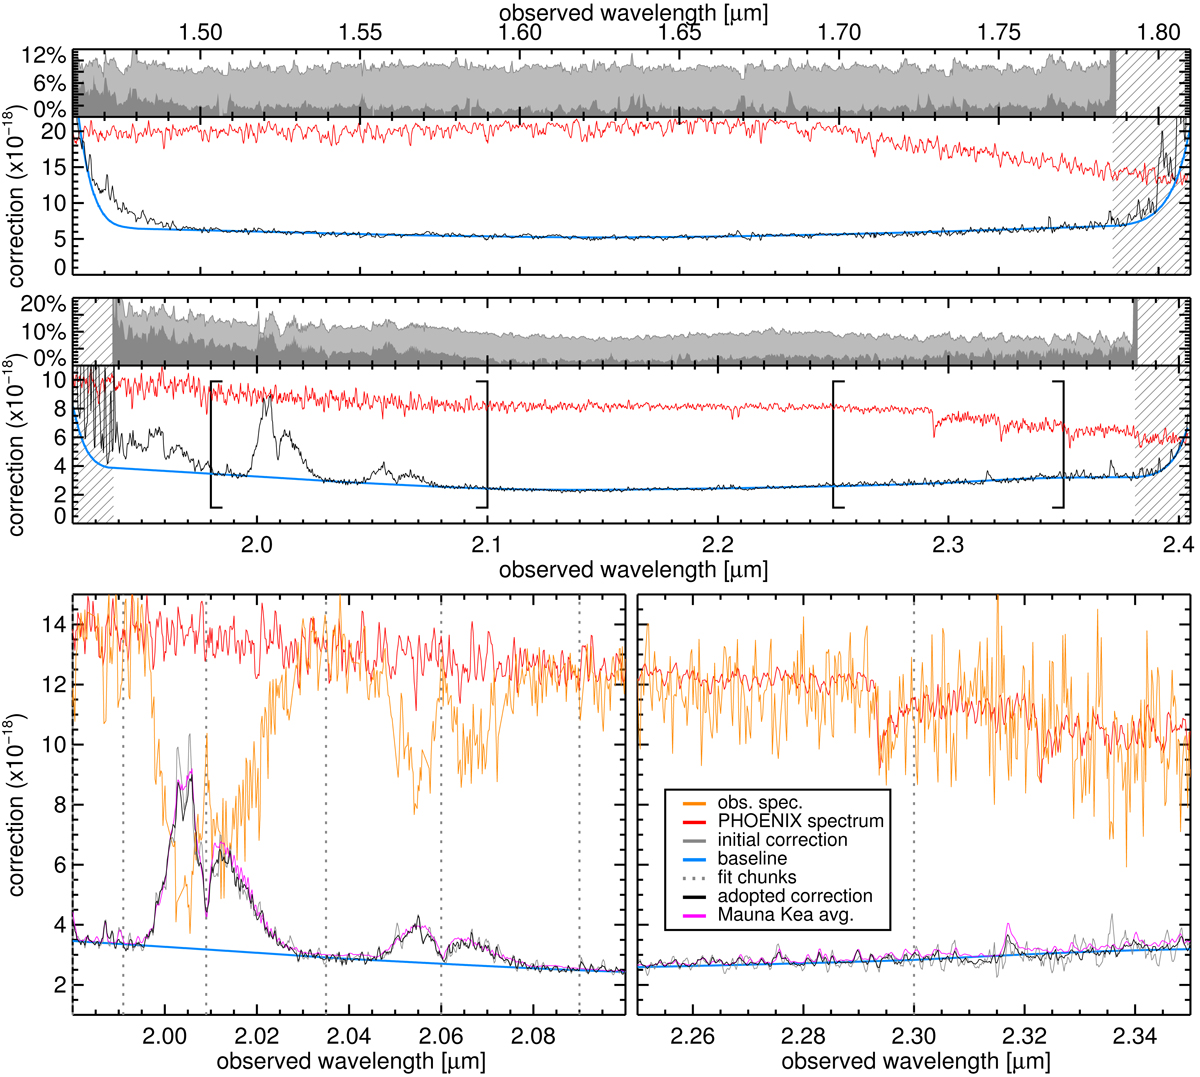
Example transmission correction curve for one exposure of the COSMOS run using the slit star (an M 5 star). As discussed in the text, this correction accounts for the telluric absorption, the filter transmission, slit loss (for a point source), and absolute calibration from electron/s to flux. Top: adopted correction curve in H (top) and K (bottom) for this exposure (black line), assumed intrinsic spectrum of the slit star (red line) and adopted transmission “baseline” (blue line, see text). The hashed regions indicate the portion of the spectrum for which we used the Mauna Kea average transmission. The inset at the top of each plot shows the relative variation of the transmission among all exposures, showing either the full variation between exposures (light gray) or what remains after factoring out variations of global transmission (dark gray). Bottom: zoom-ins on the K-band correction curve (areas bracketed in the plot above). In addition to the lines shown above, we show the raw observed spectrum multiplied by the baseline correction (orange line), the initial correction derived from this spectrum (light gray line), the individual wavelength chunks of the template curve (dotted vertical lines) and the expected correction based on the average Mauna Kea transmission (see text).
Current usage metrics show cumulative count of Article Views (full-text article views including HTML views, PDF and ePub downloads, according to the available data) and Abstracts Views on Vision4Press platform.
Data correspond to usage on the plateform after 2015. The current usage metrics is available 48-96 hours after online publication and is updated daily on week days.
Initial download of the metrics may take a while.