Fig. 15.
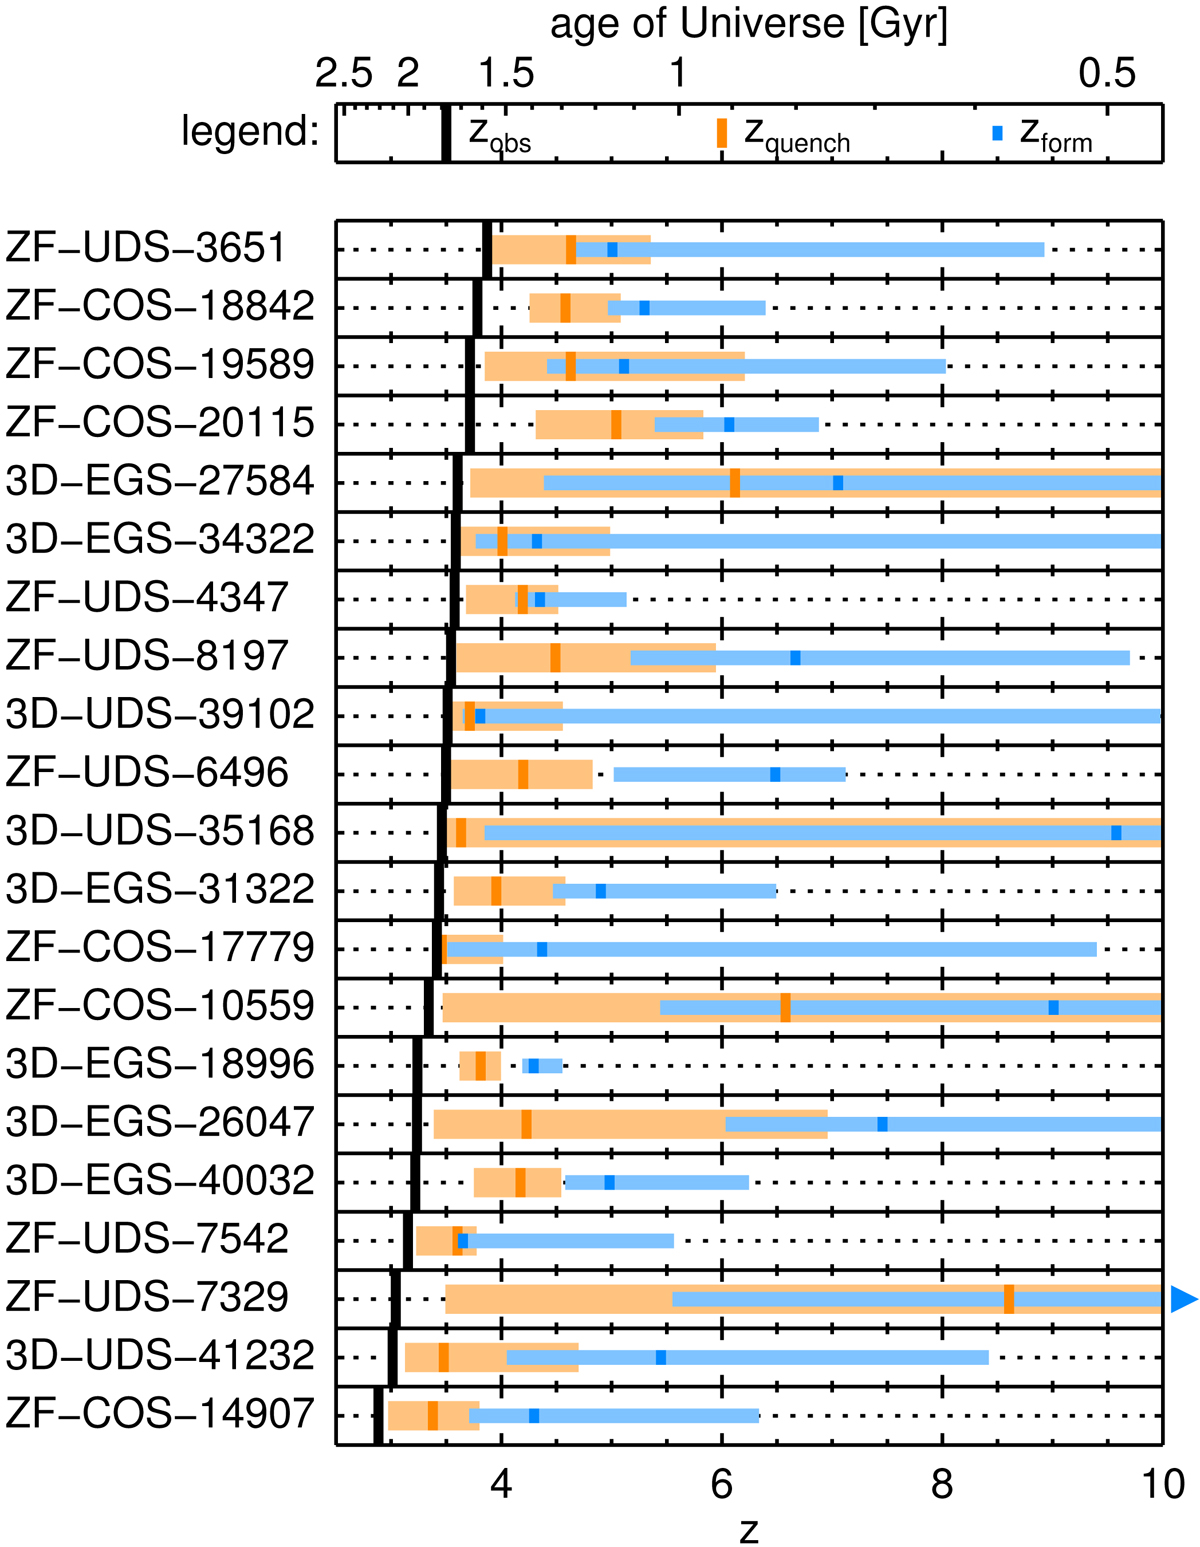
Summarized star-formation histories of our z > 3 quiescent galaxies. Galaxies are sorted by descending redshift, and are each displayed on a separate line. The black vertical bar indicates the redshift at which the galaxy is observed. The orange and blue bands show the 90% confidence range for the quenching and formation redshifts, respectively. Bars of darker colors indicate the corresponding best fit values. These values are listed in Table 3.
Current usage metrics show cumulative count of Article Views (full-text article views including HTML views, PDF and ePub downloads, according to the available data) and Abstracts Views on Vision4Press platform.
Data correspond to usage on the plateform after 2015. The current usage metrics is available 48-96 hours after online publication and is updated daily on week days.
Initial download of the metrics may take a while.