Fig. 1.
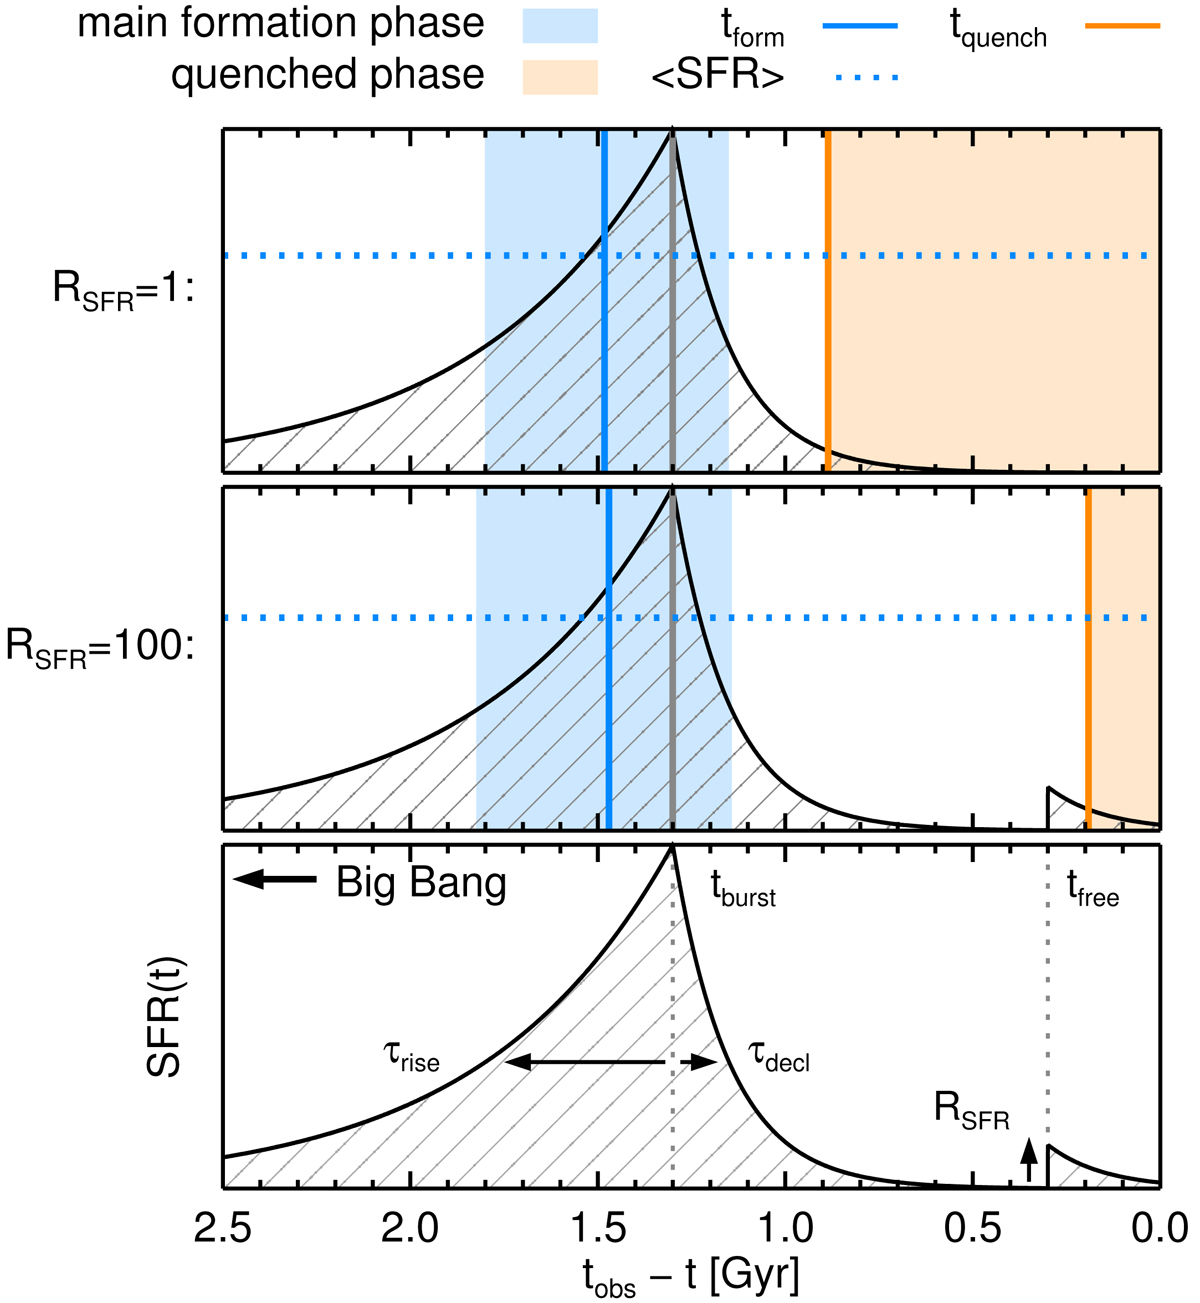
Illustration of the adopted star formation history parametrization (bottom) and the marginalized parameters (middle and top). We show the time of peak SFR (solid gray line, here coinciding with tburst), the star-forming phase surrounding it (shaded in pale blue), and the mean SFR during this phase (horizontal blue dotted line). We also display the time of quenching tquench (orange solid line) and the following quenched phase (shaded in pale orange). Finally, the time at which the galaxy had formed 50% its stars (tform) is shown with a blue solid line.
Current usage metrics show cumulative count of Article Views (full-text article views including HTML views, PDF and ePub downloads, according to the available data) and Abstracts Views on Vision4Press platform.
Data correspond to usage on the plateform after 2015. The current usage metrics is available 48-96 hours after online publication and is updated daily on week days.
Initial download of the metrics may take a while.